Weekly #CrudeOil chart
The #commodity now has formed a descending triangle
Price now bear 200 DMA
sustaining above 93 , it may rise towards 118 as shown,
below 93, likely to drop towards 58 over the winter (economic slowdown scenario)
#OOTT #Bidenflation #inflation

More from Techno Prince


#LLTS Weekly chart shows the stock is recovering from 61.8% fibonacci pullback of last major rise
— Techno Prince (@Trader_souradep) July 24, 2022
Daily chart shows a a rounding bottom , daily RSI bullish
If it sustains above 3500 it can move towards 3900+ levels and later towards 200 DMA 4480#Nifty pic.twitter.com/6ebtfLMJZd

More from Crudeoillongterm

A quick thread 🧵
Daily TF
With the turn-around in price from the initial harmonic pattern, Consequent LH-LL's in place.
Below $101.56, We might catch sight of $87 followed by $78 https://t.co/nvzolftng6
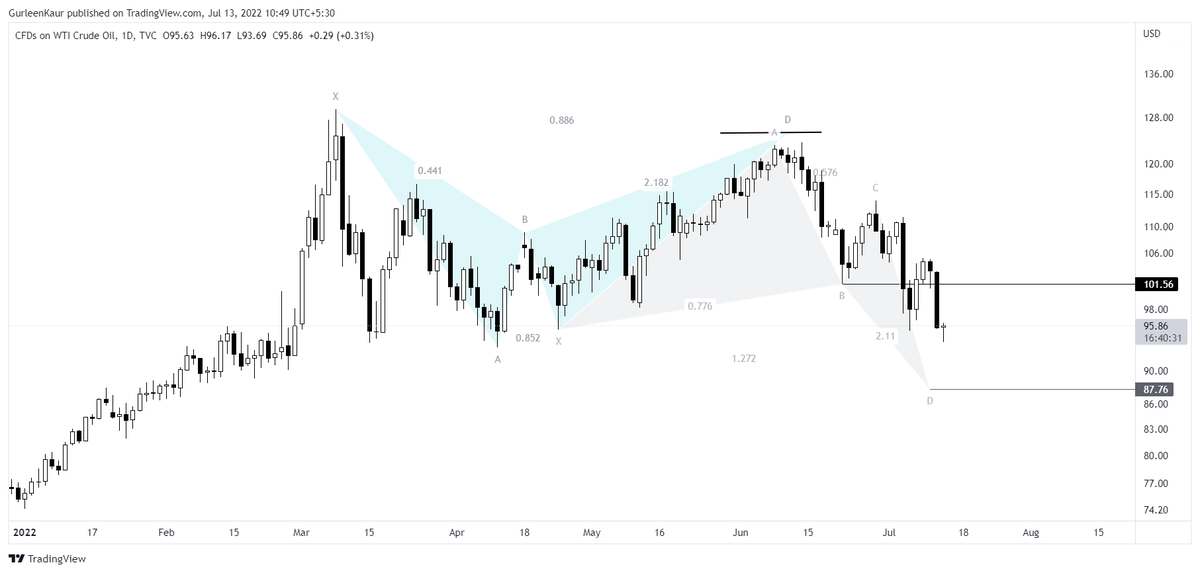
$USOIL
— Gurleen (@GurleenKaur_19) June 6, 2022
With the inching up of reaction lows, the targets are placed at $125 and $134.
In a different case scenario, Let's not rule out the possibility- If the price continues to sustain above the level of $104, Might see a hit towards the level of $150 as well. #CrudeOil pic.twitter.com/p52TnRkBqC
On the Weekly TF, If the price slips and closes below $92.96, the target would be $70.
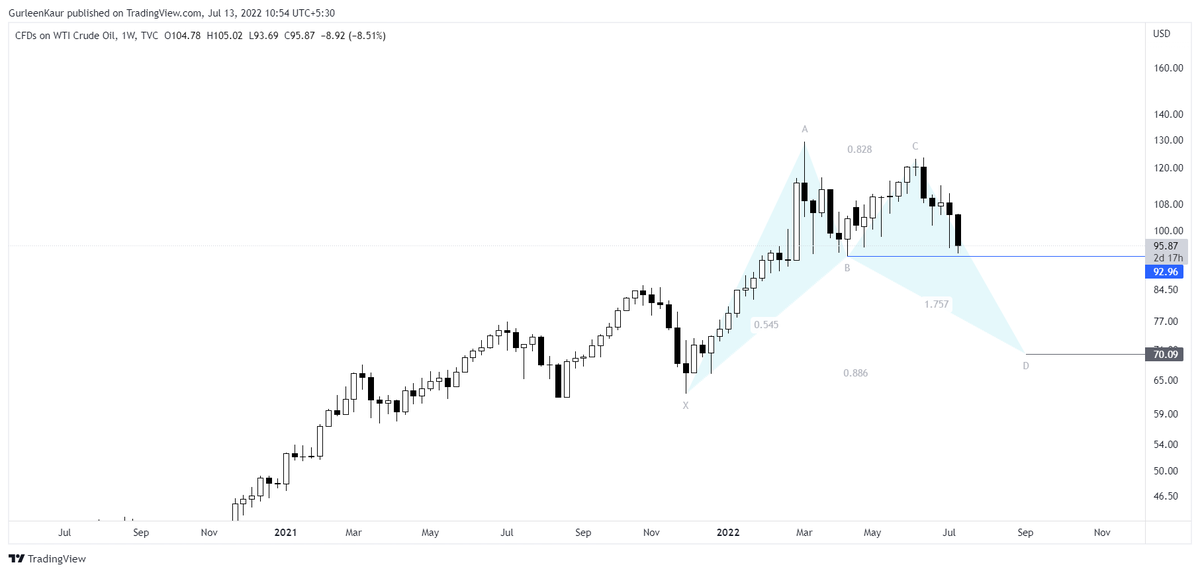

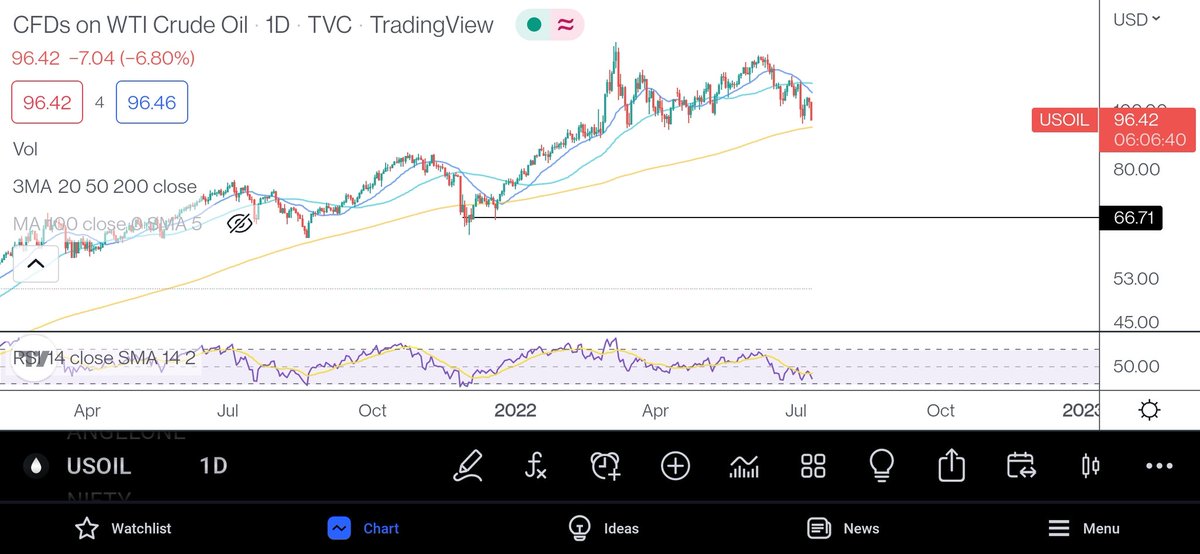


Needs to break below this level for real impact. https://t.co/r5KoExzFKc
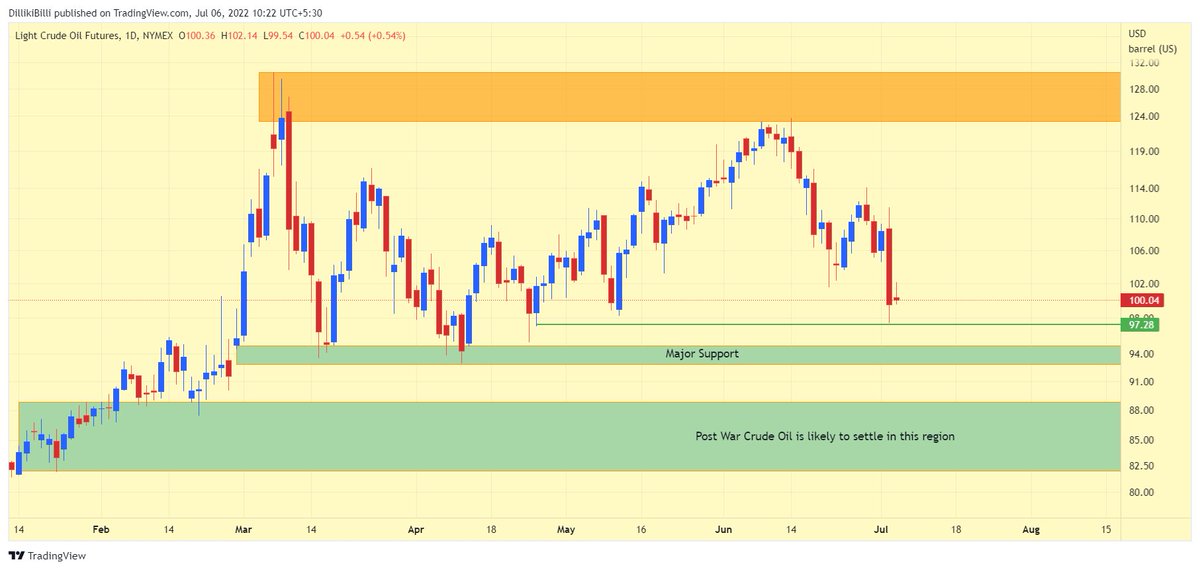
NYMEX Crude Oil update !
— Professor (@DillikiBiili) July 1, 2022
Its not ready to come below US$ 100 which is a big psychological level ! Everytime it comes near that zone, it takes a bounce. https://t.co/xQ3dZZXNiu pic.twitter.com/7WS38JU6JF
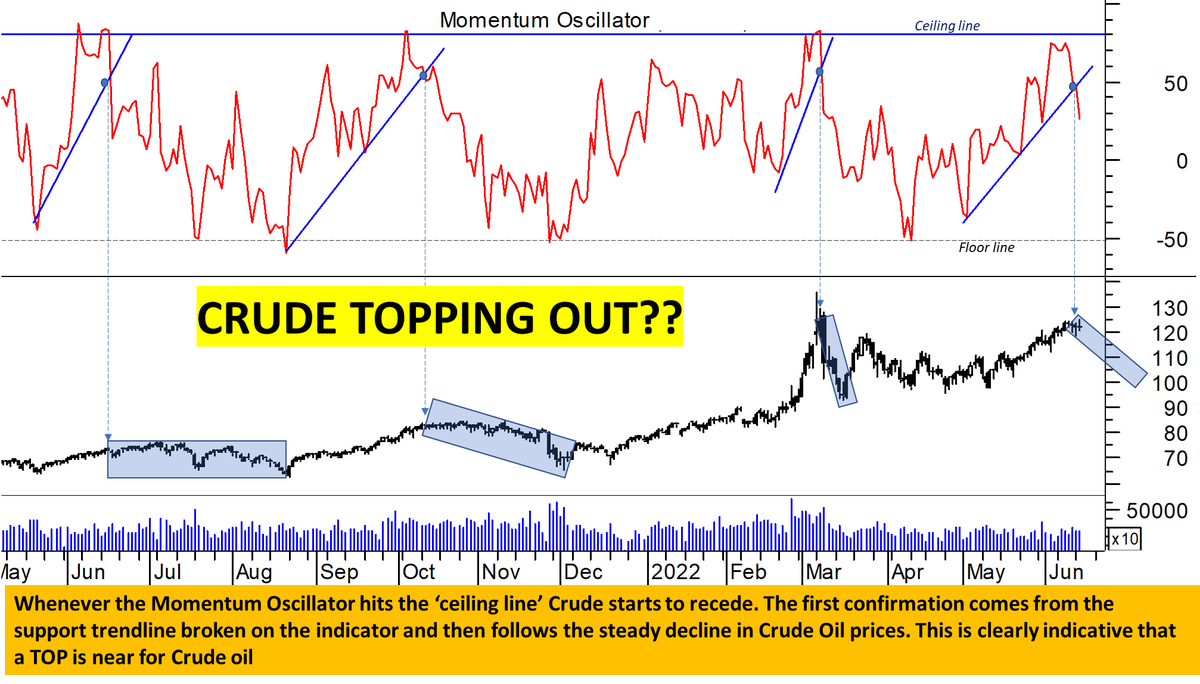
Interesting Derivatives Data…
#MarketsWithETNOW | Is the #crude concern overblown? What do the charts indicate? What will be the trend going forward? Watch to find out as @kbbothra analyses #Brent #Crude #Oil #StockMarket pic.twitter.com/4SBSfpiKmd
— ET NOW (@ETNOWlive) June 1, 2022
You May Also Like

This New York Times feature shows China with a Gini Index of less than 30, which would make it more equal than Canada, France, or the Netherlands. https://t.co/g3Sv6DZTDE
That's weird. Income inequality in China is legendary.
Let's check this number.
2/The New York Times cites the World Bank's recent report, "Fair Progress? Economic Mobility across Generations Around the World".
The report is available here:
3/The World Bank report has a graph in which it appears to show the same value for China's Gini - under 0.3.
The graph cites the World Development Indicators as its source for the income inequality data.

4/The World Development Indicators are available at the World Bank's website.
Here's the Gini index: https://t.co/MvylQzpX6A
It looks as if the latest estimate for China's Gini is 42.2.
That estimate is from 2012.
5/A Gini of 42.2 would put China in the same neighborhood as the U.S., whose Gini was estimated at 41 in 2013.
I can't find the <30 number anywhere. The only other estimate in the tables for China is from 2008, when it was estimated at 42.8.