
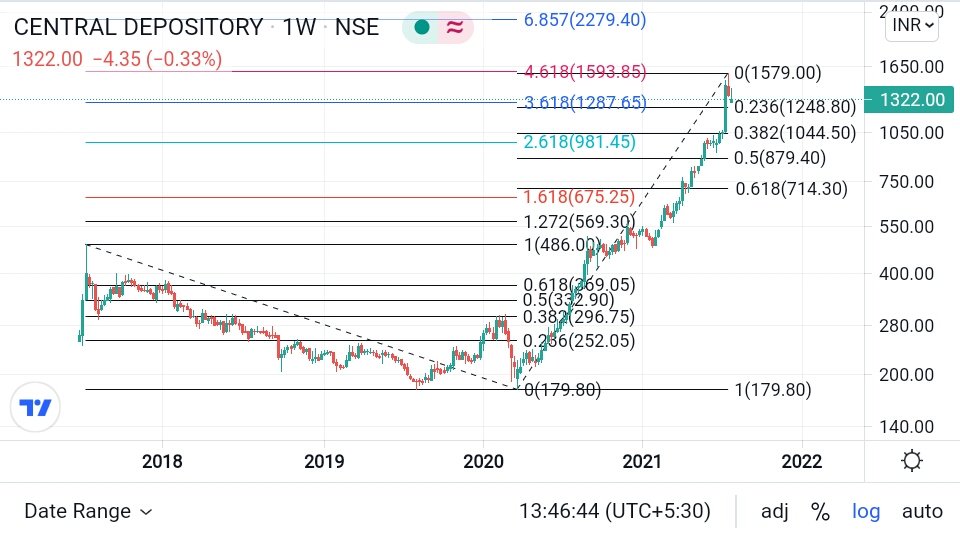
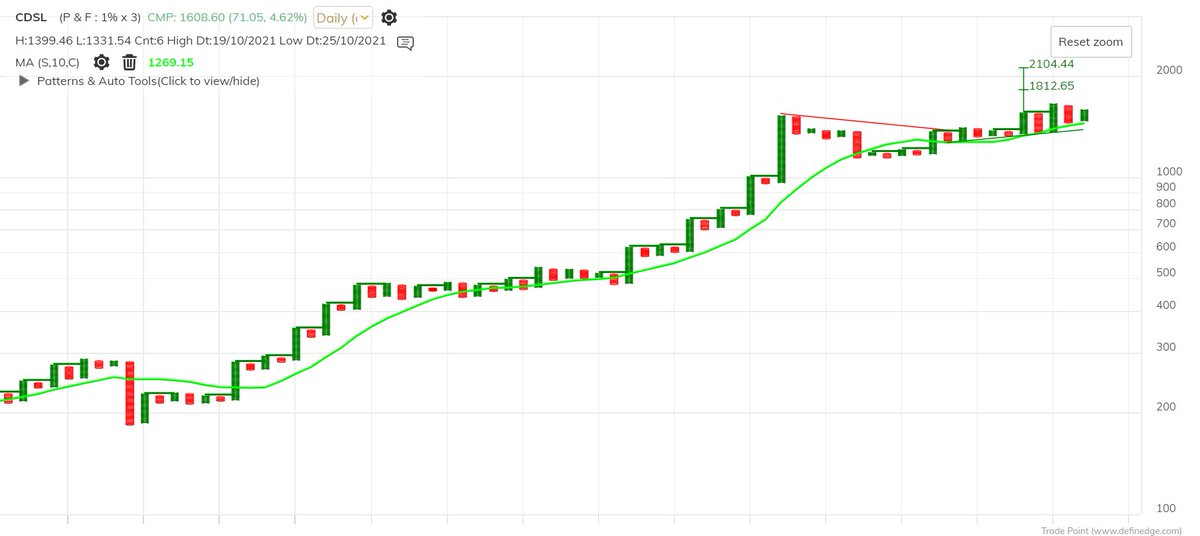
#CDSL -1305
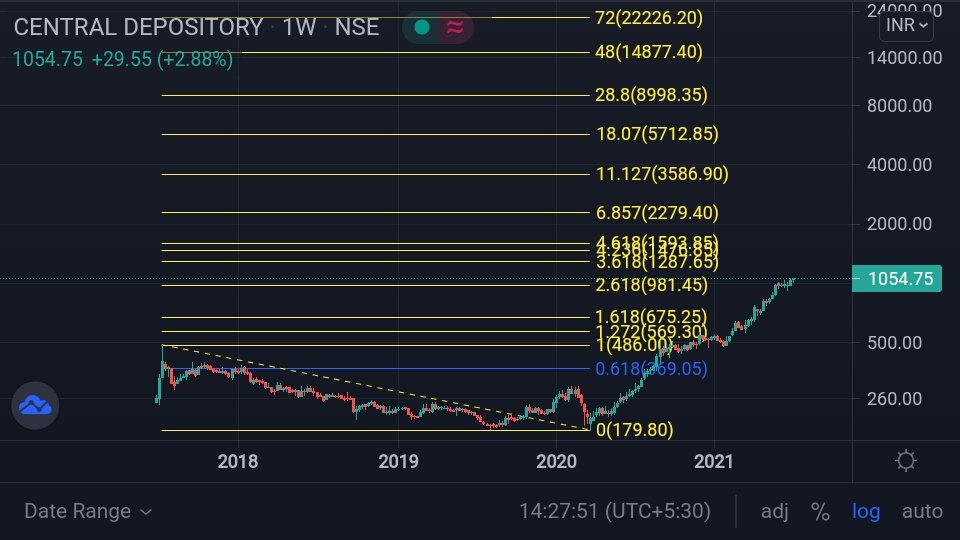
After almost attained 4.618%
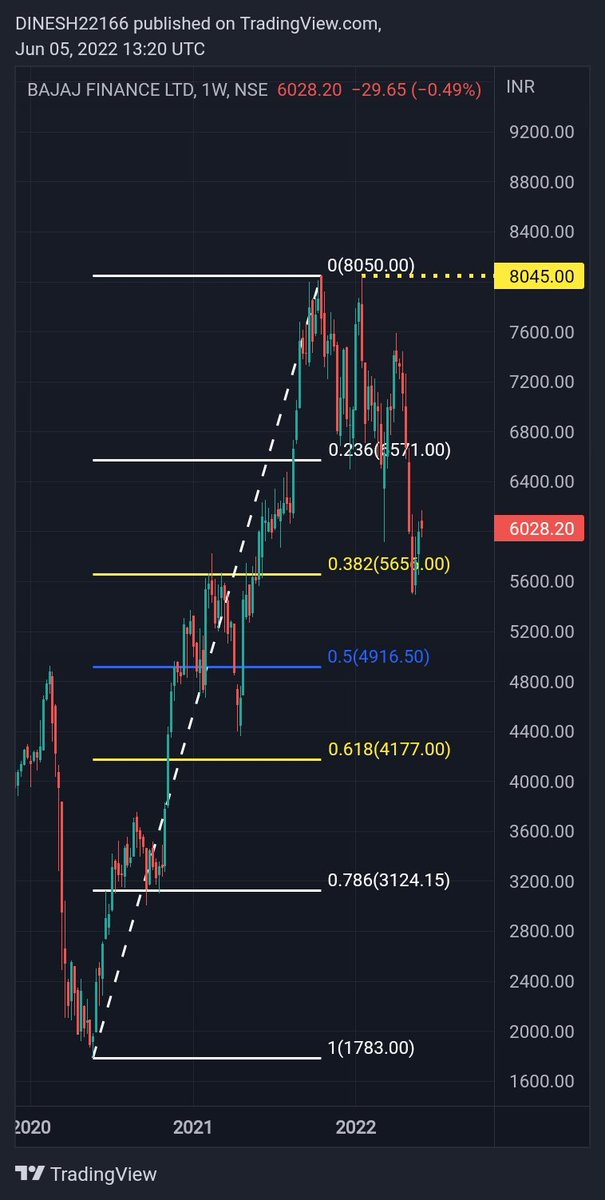
Correction likely retracement level shown in chart.
#Possibility
More from MaRkET WaVES (DINESH PATEL ) Stock Market FARMER

More from Cdsl

#CDSL beautiful company with nice uptrending price chart.....45%ROI in 54 trading days since first post ....#TrendFollowing #Pyramiding #AveragingUp ... https://t.co/25hh9QKamu
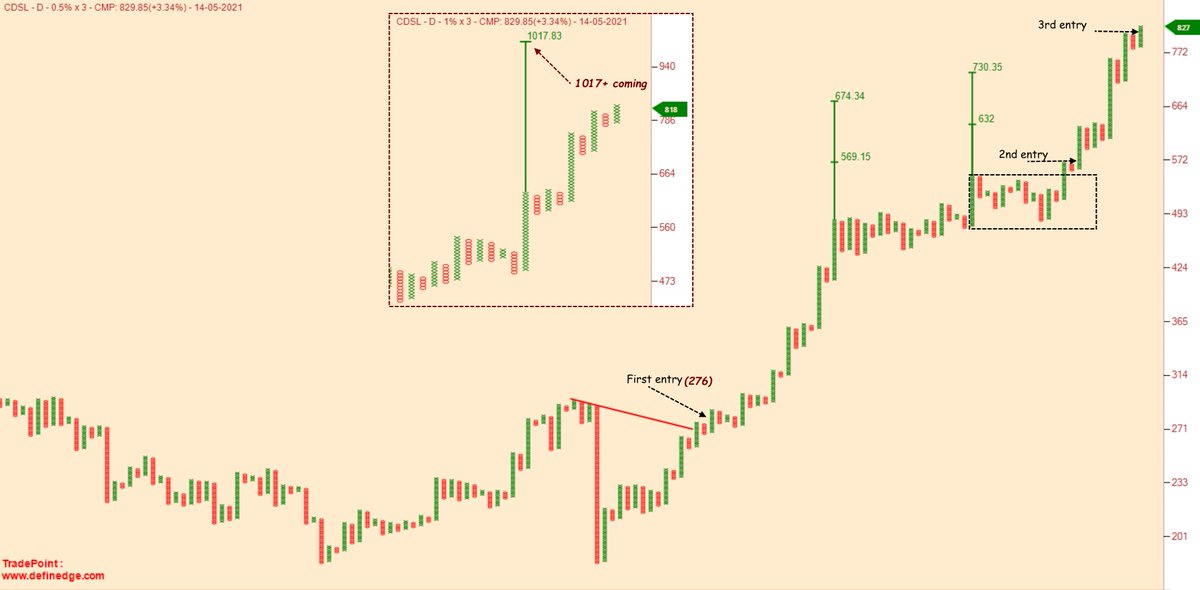
#CDSL another holding from lower levels...now looks ready for further northward journey.... #TechnoFundaPick #ADB pic.twitter.com/A3cjRV94Ew
— Akaash (@thepnfway) February 19, 2021

CDSL - Learning.... ✅✅
I believe 5-10 stocks are enough for a retail investor to achieve super performance. And with small capital, there is no point in buying 20/30 names which doesn't even get appropriate initial capital.
I believe 5-10 stocks are enough for a retail investor to achieve super performance. And with small capital, there is no point in buying 20/30 names which doesn't even get appropriate initial capital.
Stock: CDSL
— Steve Nison (@nison_steve) December 16, 2020
CMP - 516.95. Low risk setup. Weak below 500. Target open. Stock retesting the ascending triangle BO line. Kindly check please. @nishkumar1977 @Rishikesh_ADX @VijayThk @kuttrapali @Thekalal @PAVLeader pic.twitter.com/PlcpOMsdnz


You May Also Like


Great article from @AsheSchow. I lived thru the 'Satanic Panic' of the 1980's/early 1990's asking myself "Has eveyrbody lost their GODDAMN MINDS?!"
The 3 big things that made the 1980's/early 1990's surreal for me.
1) Satanic Panic - satanism in the day cares ahhhh!
2) "Repressed memory" syndrome
3) Facilitated Communication [FC]
All 3 led to massive abuse.
"Therapists" -and I use the term to describe these quacks loosely - would hypnotize people & convince they they were 'reliving' past memories of Mom & Dad killing babies in Satanic rituals in the basement while they were growing up.
Other 'therapists' would badger kids until they invented stories about watching alligators eat babies dropped into a lake from a hot air balloon. Kids would deny anything happened for hours until the therapist 'broke through' and 'found' the 'truth'.
FC was a movement that started with the claim severely handicapped individuals were able to 'type' legible sentences & communicate if a 'helper' guided their hands over a keyboard.
For three years I have wanted to write an article on moral panics. I have collected anecdotes and similarities between today\u2019s moral panic and those of the past - particularly the Satanic Panic of the 80s.
— Ashe Schow (@AsheSchow) September 29, 2018
This is my finished product: https://t.co/otcM1uuUDk
The 3 big things that made the 1980's/early 1990's surreal for me.
1) Satanic Panic - satanism in the day cares ahhhh!
2) "Repressed memory" syndrome
3) Facilitated Communication [FC]
All 3 led to massive abuse.
"Therapists" -and I use the term to describe these quacks loosely - would hypnotize people & convince they they were 'reliving' past memories of Mom & Dad killing babies in Satanic rituals in the basement while they were growing up.
Other 'therapists' would badger kids until they invented stories about watching alligators eat babies dropped into a lake from a hot air balloon. Kids would deny anything happened for hours until the therapist 'broke through' and 'found' the 'truth'.
FC was a movement that started with the claim severely handicapped individuals were able to 'type' legible sentences & communicate if a 'helper' guided their hands over a keyboard.
