
@AriBerman More complicated than that summary suggests...
Who determined which Florida counties to recount?
What were the local voting issues?
The "Butterfly ballot", hanging chads...
537 vote difference over 3 counties -- and U.S. Supreme Court intervention.
More from Categorypdfmakerapp grab thisreadwiseio save thread

So 25% of Wharton students believe the average American earns more than $100,000 per year. Normally, I'd chuckle at how "stupid" these youngsters are. These days, I despair at the level of entitlement they display. If knowledge is power, America is really freaking weak, y'all.
I asked Wharton students what they thought the average American worker makes per year and 25% of them thought it was over six figures. One of them thought it was $800k. Really not sure what to make of this (The real number is $45k)
— Nina Strohminger (@NinaStrohminger) January 20, 2022

I’ve hesitated to use the term “treason,” but @JoeNBC is using it exactly as the Constitution defines it in Article III, Clause 1:
“Treason against the United States, shall consist only in levying War against them . . .”
The insurrection levied War against the United States.
“Treason against the United States, shall consist only in levying War against them . . .”
The insurrection levied War against the United States.
.@joenbc: "It's treason. Donald Trump committed treason against the United States of America. And if you're wondering what January 6th is about, it's about treason." https://t.co/TzRxk1QtZw pic.twitter.com/YDhVApBaZp
— MSNBC (@MSNBC) July 12, 2022



I asked Wharton students what they thought the average American worker makes per year and 25% of them thought it was over six figures. One of them thought it was $800k. Really not sure what to make of this (The real number is $45k)
Oh good, I went viral
A lot of people want to conclude that this says something special about Wharton students— I’m not sure it does. People are notoriously bad at making this kind of estimate, thinking the gap between rich and poor is smaller than it is.
This was indeed why I asked bschool students: I was curious if they were as biased as everyone else. Further reading: https://t.co/OrvHCbdJO7 and
Oh good, I went viral
A lot of people want to conclude that this says something special about Wharton students— I’m not sure it does. People are notoriously bad at making this kind of estimate, thinking the gap between rich and poor is smaller than it is.
This was indeed why I asked bschool students: I was curious if they were as biased as everyone else. Further reading: https://t.co/OrvHCbdJO7 and


You May Also Like










1/OK, data mystery time.
This New York Times feature shows China with a Gini Index of less than 30, which would make it more equal than Canada, France, or the Netherlands. https://t.co/g3Sv6DZTDE
That's weird. Income inequality in China is legendary.
Let's check this number.
2/The New York Times cites the World Bank's recent report, "Fair Progress? Economic Mobility across Generations Around the World".
The report is available here:
3/The World Bank report has a graph in which it appears to show the same value for China's Gini - under 0.3.
The graph cites the World Development Indicators as its source for the income inequality data.
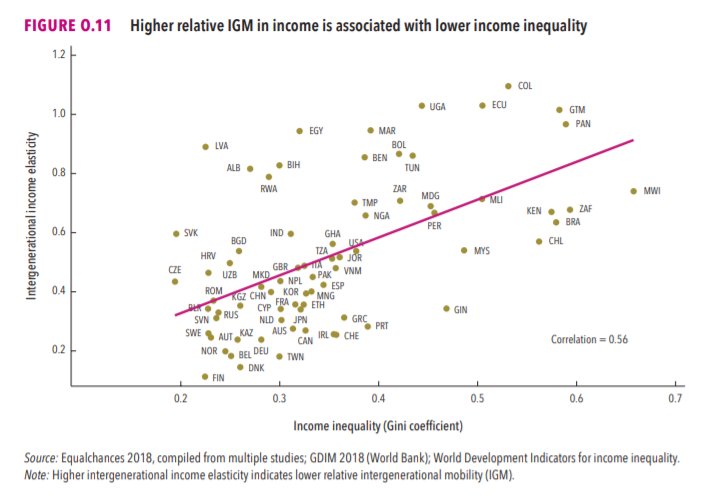
4/The World Development Indicators are available at the World Bank's website.
Here's the Gini index: https://t.co/MvylQzpX6A
It looks as if the latest estimate for China's Gini is 42.2.
That estimate is from 2012.
5/A Gini of 42.2 would put China in the same neighborhood as the U.S., whose Gini was estimated at 41 in 2013.
I can't find the <30 number anywhere. The only other estimate in the tables for China is from 2008, when it was estimated at 42.8.
This New York Times feature shows China with a Gini Index of less than 30, which would make it more equal than Canada, France, or the Netherlands. https://t.co/g3Sv6DZTDE
That's weird. Income inequality in China is legendary.
Let's check this number.
2/The New York Times cites the World Bank's recent report, "Fair Progress? Economic Mobility across Generations Around the World".
The report is available here:
3/The World Bank report has a graph in which it appears to show the same value for China's Gini - under 0.3.
The graph cites the World Development Indicators as its source for the income inequality data.
4/The World Development Indicators are available at the World Bank's website.
Here's the Gini index: https://t.co/MvylQzpX6A
It looks as if the latest estimate for China's Gini is 42.2.
That estimate is from 2012.
5/A Gini of 42.2 would put China in the same neighborhood as the U.S., whose Gini was estimated at 41 in 2013.
I can't find the <30 number anywhere. The only other estimate in the tables for China is from 2008, when it was estimated at 42.8.

✨📱 iOS 12.1 📱✨
🗓 Release date: October 30, 2018
📝 New Emojis: 158
https://t.co/bx8XjhiCiB
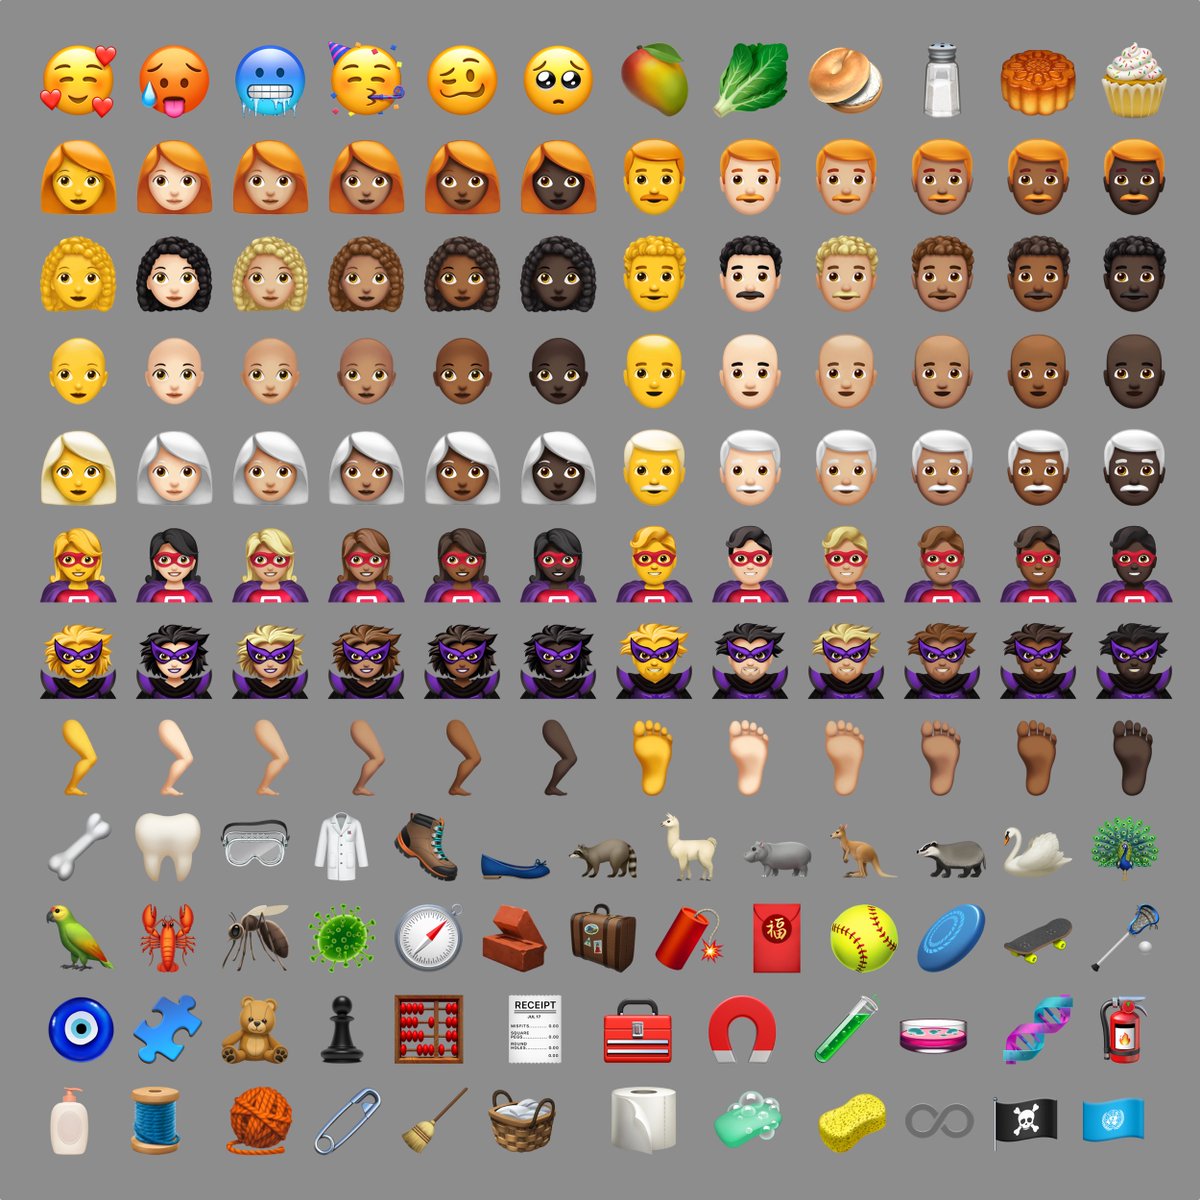
New in iOS 12.1: 🥰 Smiling Face With 3 Hearts https://t.co/6eajdvueip

New in iOS 12.1: 🥵 Hot Face https://t.co/jhTv1elltB

New in iOS 12.1: 🥶 Cold Face https://t.co/EIjyl6yZrF

New in iOS 12.1: 🥳 Partying Face https://t.co/p8FDNEQ3LJ

🗓 Release date: October 30, 2018
📝 New Emojis: 158
https://t.co/bx8XjhiCiB
New in iOS 12.1: 🥰 Smiling Face With 3 Hearts https://t.co/6eajdvueip
New in iOS 12.1: 🥵 Hot Face https://t.co/jhTv1elltB
New in iOS 12.1: 🥶 Cold Face https://t.co/EIjyl6yZrF
New in iOS 12.1: 🥳 Partying Face https://t.co/p8FDNEQ3LJ


