https://t.co/AmtfH43zzX
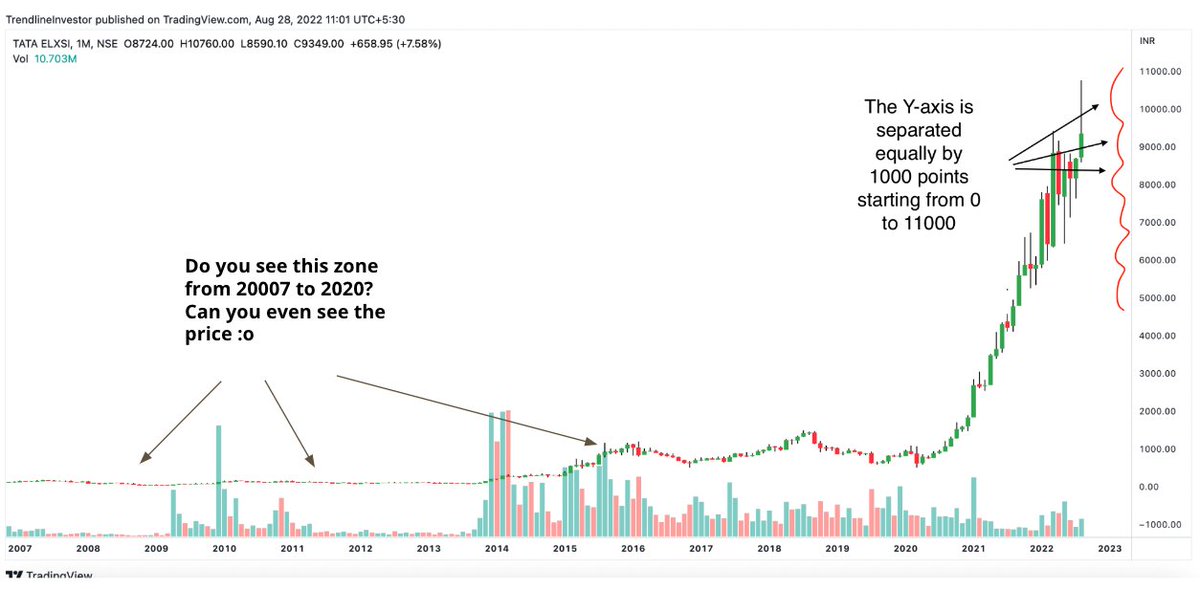
FREE Stock Trading Courses and Tutorials ๐
A thread ๐งต๐๐ป
More from Catagory trading
๐งต STOP wasting time searching for stocks.
Unlock the stock screener that makes it easy:
Check out the stocks that have broken through their 52-week highs on https://t.co/qBvDaqyp9R. They are some of the strongest in the market, so be sure to consider technicalities when trading them.
You've definitely heard of Darvas. Here's your chance to put his strategy into action: https://t.co/bk82BA8MMF
Intraday lovers: https://t.co/7Y866T9bRt
Do you know that narrow range breakout gives a punching returns in short span- https://t.co/vYfluY3TEH
Unlock the stock screener that makes it easy:
Check out the stocks that have broken through their 52-week highs on https://t.co/qBvDaqyp9R. They are some of the strongest in the market, so be sure to consider technicalities when trading them.
You've definitely heard of Darvas. Here's your chance to put his strategy into action: https://t.co/bk82BA8MMF

Intraday lovers: https://t.co/7Y866T9bRt

Do you know that narrow range breakout gives a punching returns in short span- https://t.co/vYfluY3TEH

๐๐ผ๐ ๐๐ผ ๐ฐ๐ฟ๐ฒ๐ฎ๐๐ฒ ๐๐ผ๐๐ฟ ๐ผ๐๐ป ๐๐ต๐ฎ๐ฟ๐๐ถ๐ป๐ธ ๐ฆ๐ฐ๐ฟ๐ฒ๐ฒ๐ป๐ฒ๐ฟ
๐งต Thread ๐งต
[1/15]
๐๐ต๐ฎ๐ฟ๐๐ถ๐ป๐ธ ๐ฆ๐ฐ๐ฟ๐ฒ๐ฒ๐ป๐ฒ๐ฟ is a Stock screening tool that is useful to screen stocks based on Technical & Fundamentals.
๐ธ It scans stocks by using technical indicators like RSI, MACD, divergences, etc.
๐ธ It also uses fundamental tools like Book Value, EPS,PE etc
[2/15]
How To Create A Scan ?
Go to https://t.co/JJEJBg3Cd8 & click on ๐๐ณ๐ฆ๐ข๐ต๐ฆ ๐๐ค๐ข๐ฏ under ๐๐ค๐ณ๐ฆ๐ฆ๐ฏ๐ฆ๐ณ๐ด.
[3/15]
๐๐ถ๐ฟ๐๐ ๐ฆ๐๐ฒ๐ฝ ๐ง๐ผ ๐๐ถ๐น๐๐ฒ๐ฟ ๐ฆ๐๐ผ๐ฐ๐ธ๐
We can select segments of stocks of our choice, e.g. cash or futures stocks, Nifty 100 etc.
Click on green โ+โ icon to add conditions.
[4/15]
๐๐ฎ๐ป๐ฑ๐น๐ฒ ๐ง๐ถ๐บ๐ฒ๐ณ๐ฟ๐ฎ๐บ๐ฒ๐ & ๐๐ผ๐บ๐ฝ๐ฎ๐ฟ๐ถ๐๐ผ๐ป ๐ข๐ฝ๐ฒ๐ฟ๐ฎ๐๐ผ๐ฟ๐๐ธ We can select any timeframe of candles in Chartink, from minutes to years.
๐ธ And compare two candles using comparison operators like ๐๐ฒ๐ถ๐ข๐ญ ๐ต๐ฐ or ๐๐ณ๐ฆ๐ข๐ต๐ฆ๐ณ ๐๐ฉ๐ข๐ฏ , crossovers etc
[5/15]
๐งต Thread ๐งต
[1/15]
๐๐ต๐ฎ๐ฟ๐๐ถ๐ป๐ธ ๐ฆ๐ฐ๐ฟ๐ฒ๐ฒ๐ป๐ฒ๐ฟ is a Stock screening tool that is useful to screen stocks based on Technical & Fundamentals.
๐ธ It scans stocks by using technical indicators like RSI, MACD, divergences, etc.
๐ธ It also uses fundamental tools like Book Value, EPS,PE etc
[2/15]
How To Create A Scan ?
Go to https://t.co/JJEJBg3Cd8 & click on ๐๐ณ๐ฆ๐ข๐ต๐ฆ ๐๐ค๐ข๐ฏ under ๐๐ค๐ณ๐ฆ๐ฆ๐ฏ๐ฆ๐ณ๐ด.
[3/15]

๐๐ถ๐ฟ๐๐ ๐ฆ๐๐ฒ๐ฝ ๐ง๐ผ ๐๐ถ๐น๐๐ฒ๐ฟ ๐ฆ๐๐ผ๐ฐ๐ธ๐
We can select segments of stocks of our choice, e.g. cash or futures stocks, Nifty 100 etc.
Click on green โ+โ icon to add conditions.
[4/15]

๐๐ฎ๐ป๐ฑ๐น๐ฒ ๐ง๐ถ๐บ๐ฒ๐ณ๐ฟ๐ฎ๐บ๐ฒ๐ & ๐๐ผ๐บ๐ฝ๐ฎ๐ฟ๐ถ๐๐ผ๐ป ๐ข๐ฝ๐ฒ๐ฟ๐ฎ๐๐ผ๐ฟ๐๐ธ We can select any timeframe of candles in Chartink, from minutes to years.
๐ธ And compare two candles using comparison operators like ๐๐ฒ๐ถ๐ข๐ญ ๐ต๐ฐ or ๐๐ณ๐ฆ๐ข๐ต๐ฆ๐ณ ๐๐ฉ๐ข๐ฏ , crossovers etc
[5/15]

You May Also Like
Nano Course On Python For Trading
==========================
Module 1
Python makes it very easy to analyze and visualize time series data when youโre a beginner. It's easier when you don't have to install python on your PC (that's why it's a nano course, you'll learn python...
... on the go). You will not be required to install python in your PC but you will be using an amazing python editor, Google Colab Visit https://t.co/EZt0agsdlV
This course is for anyone out there who is confused, frustrated, and just wants this python/finance thing to work!
In Module 1 of this Nano course, we will learn about :
# Using Google Colab
# Importing libraries
# Making a Random Time Series of Black Field Research Stock (fictional)
# Using Google Colab
Intro link is here on YT: https://t.co/MqMSDBaQri
Create a new Notebook at https://t.co/EZt0agsdlV and name it AnythingOfYourChoice.ipynb
You got your notebook ready and now the game is on!
You can add code in these cells and add as many cells as you want
# Importing Libraries
Imports are pretty standard, with a few exceptions.
For the most part, you can import your libraries by running the import.
Type this in the first cell you see. You need not worry about what each of these does, we will understand it later.
