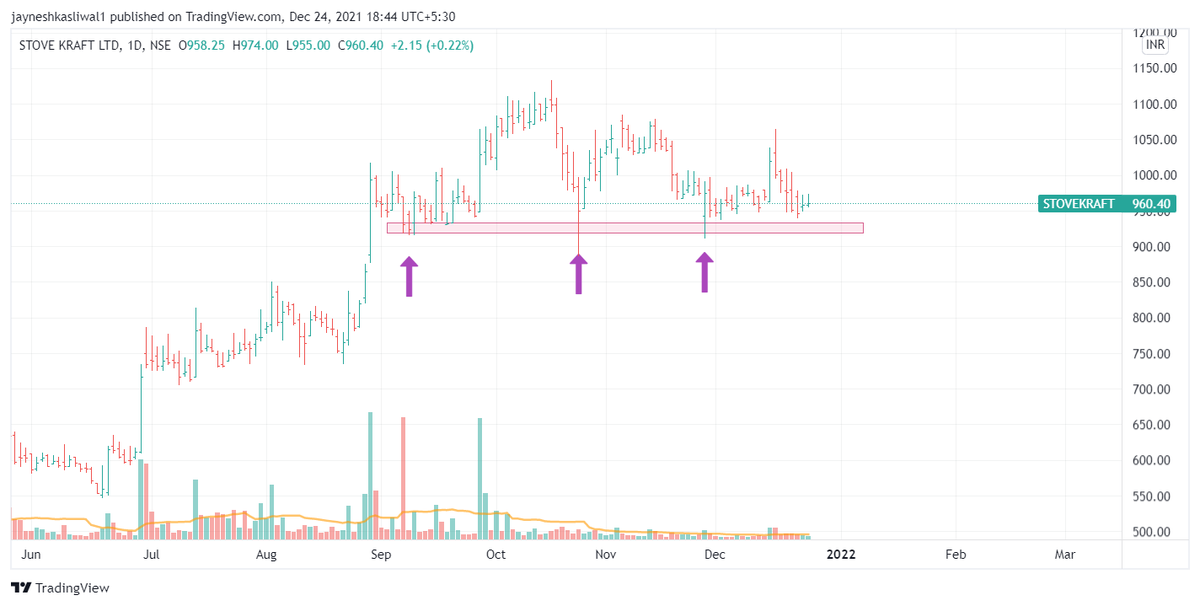
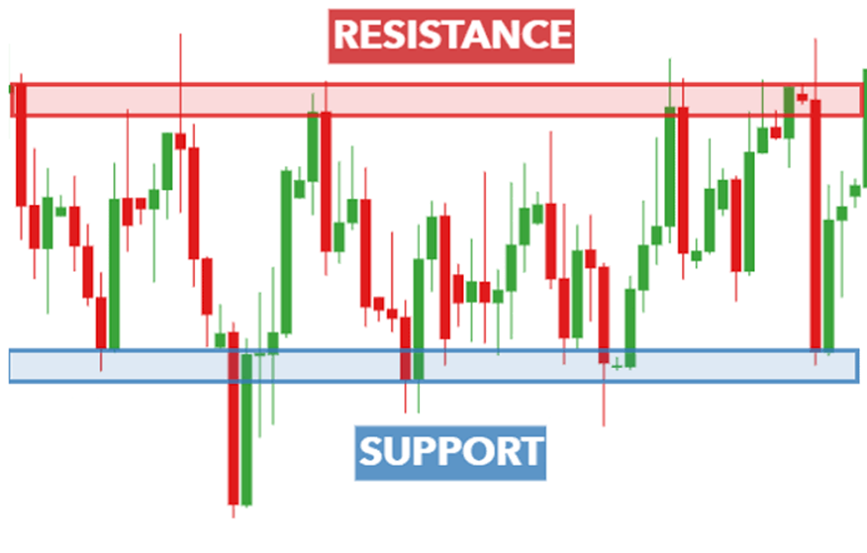
⏫Support is an area for price , where it halts due to demand of the stock at that price .
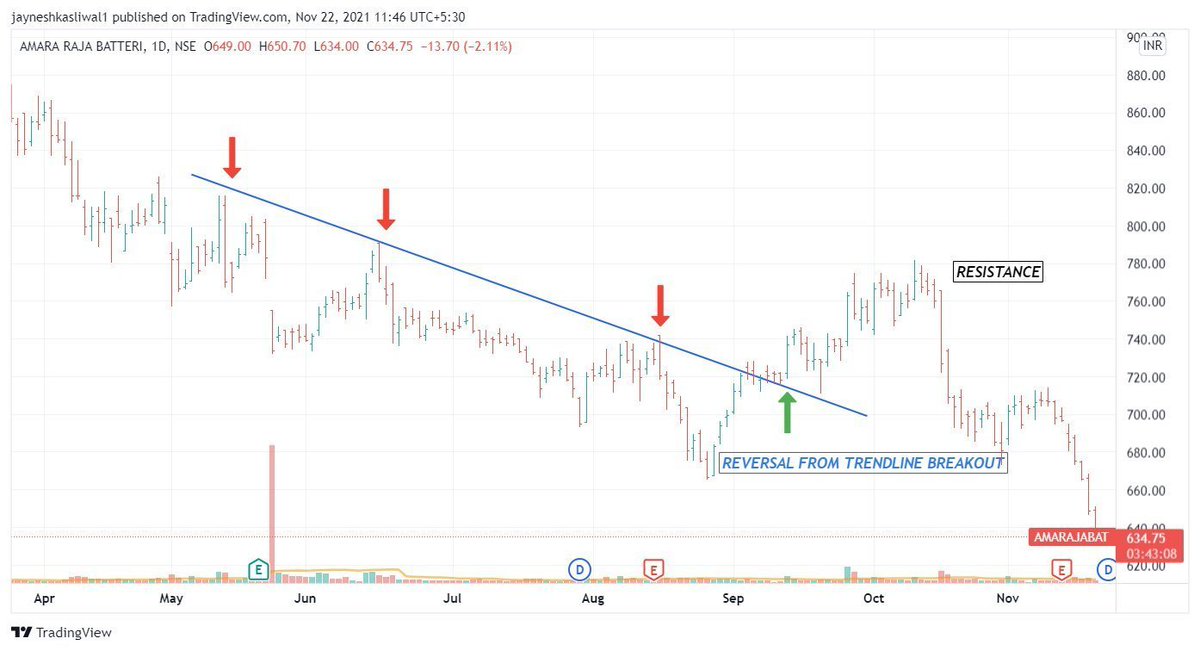
⏬Resistance is an area for price ,where it halts due to Supply of the stock at that price .
1/n


I have designed many beginner to advanced
— JayneshKasliwal (@JayneshKasliwal) September 24, 2022
Option Strategies free of cost
Here is a thread of all \U0001f9f5
A Retweet would help :)
There are many Trading Strategies but it takes only few to make money .
— JayneshKasliwal (@JayneshKasliwal) August 20, 2022
Here is a thread of all my Strategies \U0001f9f5
As Traders, Technical Analysis allows us to Judge Potential, Identify Accumulation, and Manage Risk.
— Richard Moglen \U0001f981 (@RichardMoglen) April 2, 2022
It allows us to see through the noise and interpret price action.
Here is How To Read a Stock Chart For Beginners (Thread)
The best traders have a trading plan.
— Aditya Todmal (@AdityaTodmal) February 13, 2022
But 98.8% of the new traders, don't know how to make one.
I analyzed @niki_poojary's account, to learn how we can create a plan on our own.
Here's the simple 8-step process:\U0001f9f5
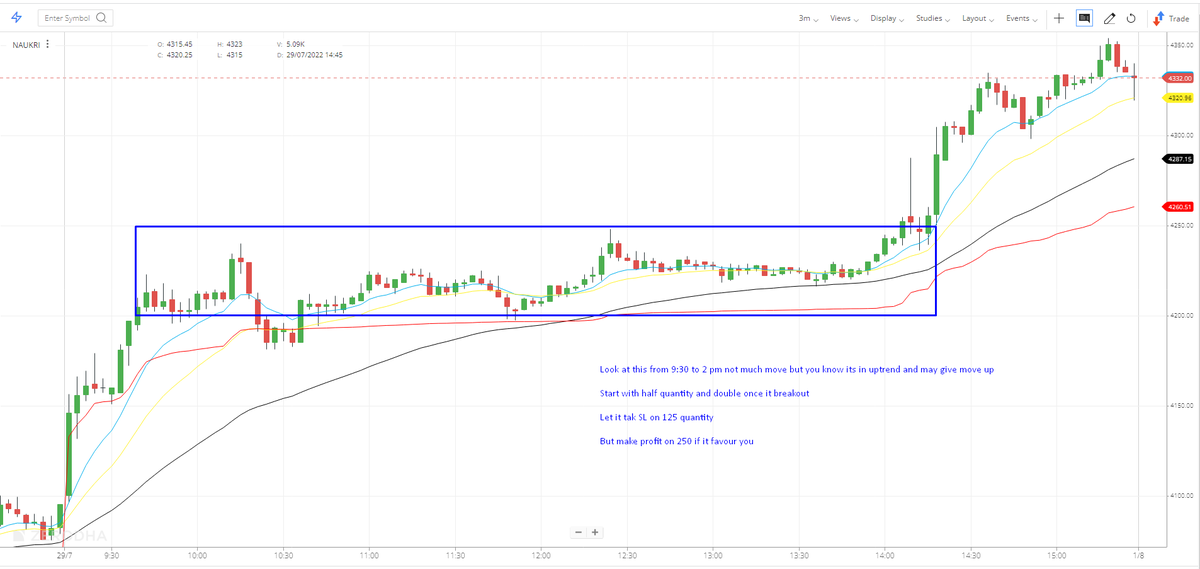
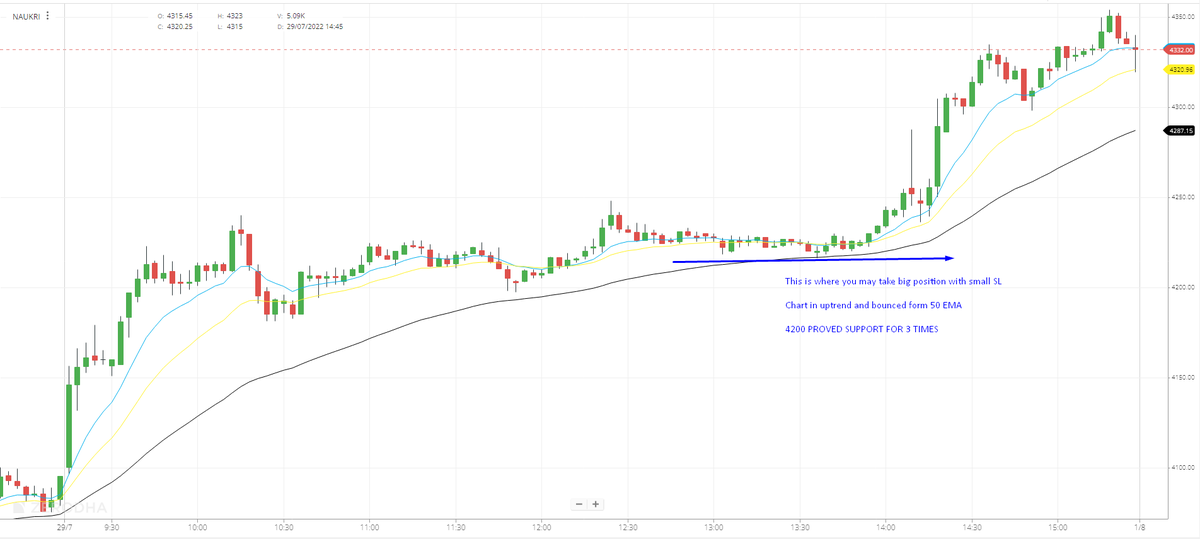
Strategy to make higher returns in Short duration :-
— Flamingo Trader |Ankit Saraswat (@FlamingoTrader_) February 21, 2022
Thread on Darvas Box Theory:-
\U0001f9f5@FlamingoTrader_
Telling my 8 years of experience in 5 min. A thread on how to find out high and lows of stock market.
— W D Gann Trader (@Bjybnf) August 5, 2022
Time Frame importance -
— My First Stock (@myfirststock99) May 14, 2022
1) 3 min - For Execution
( indicators provide early signals and less reliable)
2) 15 min - to look at trend of week, Support and Resistance of last 4-5 days
3) Daily - to check current trend and Short Term S-R (More reliability)
Charts - pic.twitter.com/SWHcQQ8m0F