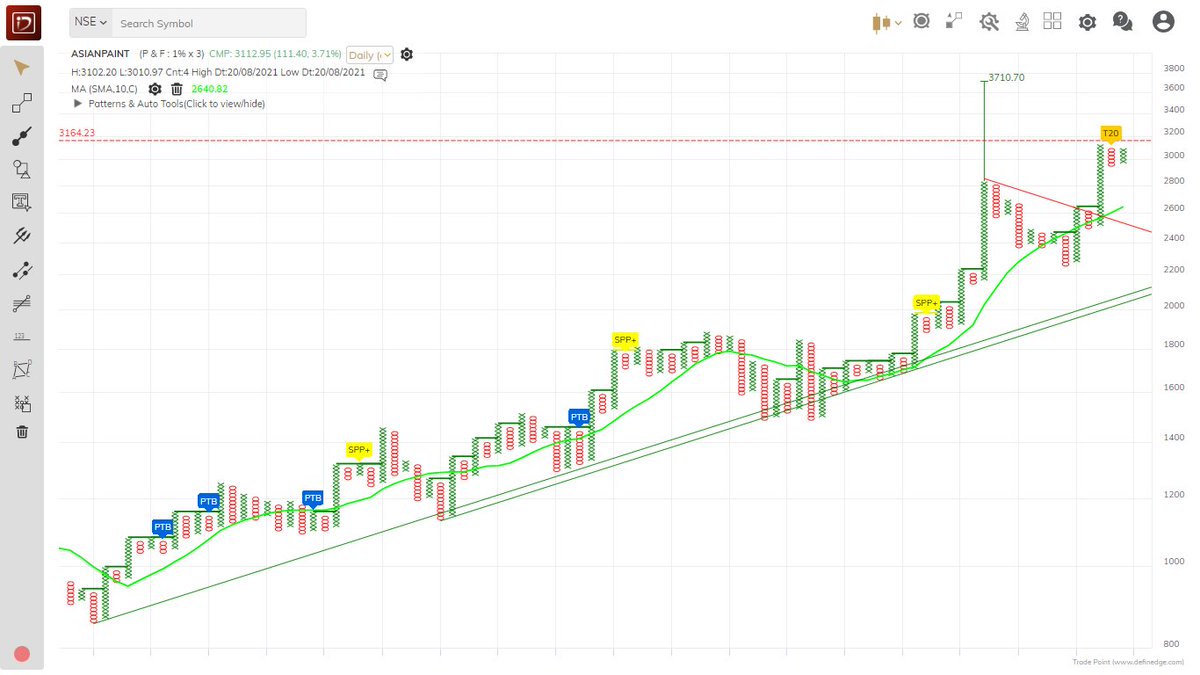
#ASIANPAINT #Weekly
Broken below the channel & then important zone of 2850, can fall towards 2270, i.e. 61.8% pullback of last rise
RSI displays downward momentum
#CrudeOil account for 60-70% of raw material cost
#stocks #StocksInFocus #Nifty
Not trading call, academic post
More from Techno Prince
More from Asianpaints
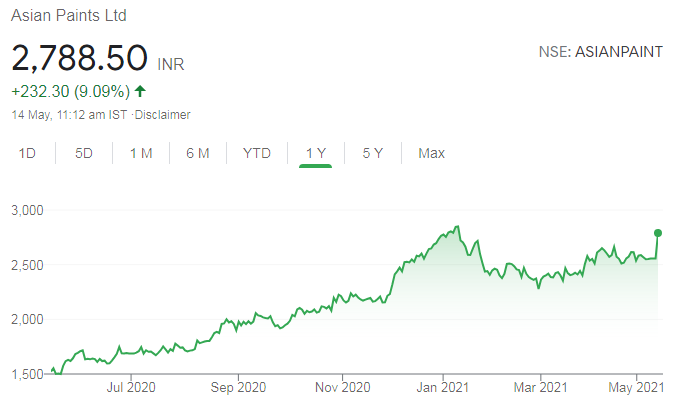
Asian Paints took a bounce exactly from the level given on 21st October.
It has string resistance at 3200, so fresh up-move will be confirmed only when it opens above 3220-3230 levels
#ASIANPAINT
#DKBPositional https://t.co/Q6fTbK5VHM
It has string resistance at 3200, so fresh up-move will be confirmed only when it opens above 3220-3230 levels
#ASIANPAINT
#DKBPositional https://t.co/Q6fTbK5VHM
Asian Paints also at crucial support line, bulls desperately need a reversal here, else it'll go in hibernation..... pic.twitter.com/VTfaMfpHXs
— Professor (@DillikiBiili) October 21, 2021
#AsianPaint Low Pole and later Double top buy above SMA after a bear trap. the earlier low pole and immediate DTB has negated the bearish anchor column. upside counts are active https://t.co/MvfHWK1IKx
#AsianPaint
— \U0001f1ee\U0001f1f3 \U0001d4d0\U0001d4f6\U0001d4f2\U0001d4fd \U0001d4e2\U0001d4ee\U0001d4fd\U0001d4f1 (@MaverickAmit01) May 23, 2022
Is it an Out of Box Idea \U0001f914 pic.twitter.com/Lg6m0AfVXB
You May Also Like
1/OK, data mystery time.
This New York Times feature shows China with a Gini Index of less than 30, which would make it more equal than Canada, France, or the Netherlands. https://t.co/g3Sv6DZTDE
That's weird. Income inequality in China is legendary.
Let's check this number.
2/The New York Times cites the World Bank's recent report, "Fair Progress? Economic Mobility across Generations Around the World".
The report is available here:
3/The World Bank report has a graph in which it appears to show the same value for China's Gini - under 0.3.
The graph cites the World Development Indicators as its source for the income inequality data.
4/The World Development Indicators are available at the World Bank's website.
Here's the Gini index: https://t.co/MvylQzpX6A
It looks as if the latest estimate for China's Gini is 42.2.
That estimate is from 2012.
5/A Gini of 42.2 would put China in the same neighborhood as the U.S., whose Gini was estimated at 41 in 2013.
I can't find the <30 number anywhere. The only other estimate in the tables for China is from 2008, when it was estimated at 42.8.