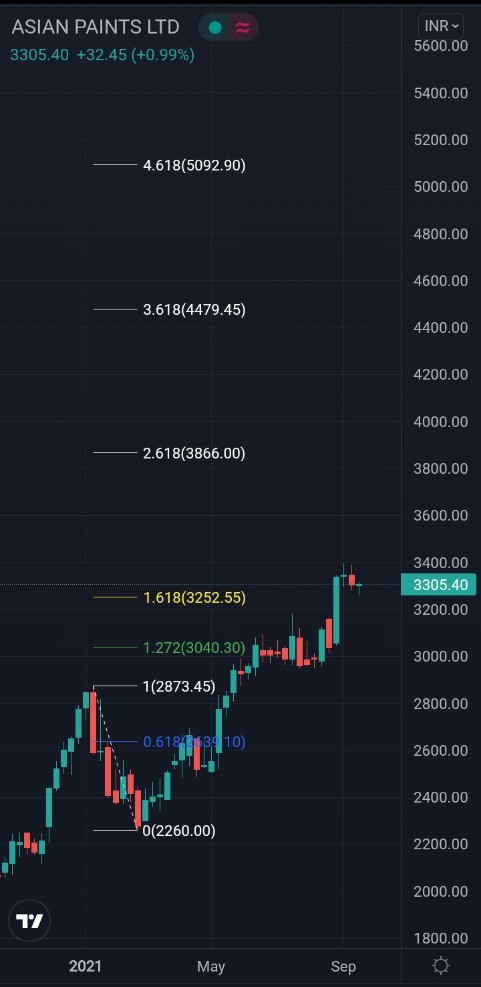
Asian Paints took a bounce exactly from the level given on 21st October.
It has string resistance at 3200, so fresh up-move will be confirmed only when it opens above 3220-3230 levels
#ASIANPAINT
#DKBPositional https://t.co/Q6fTbK5VHM
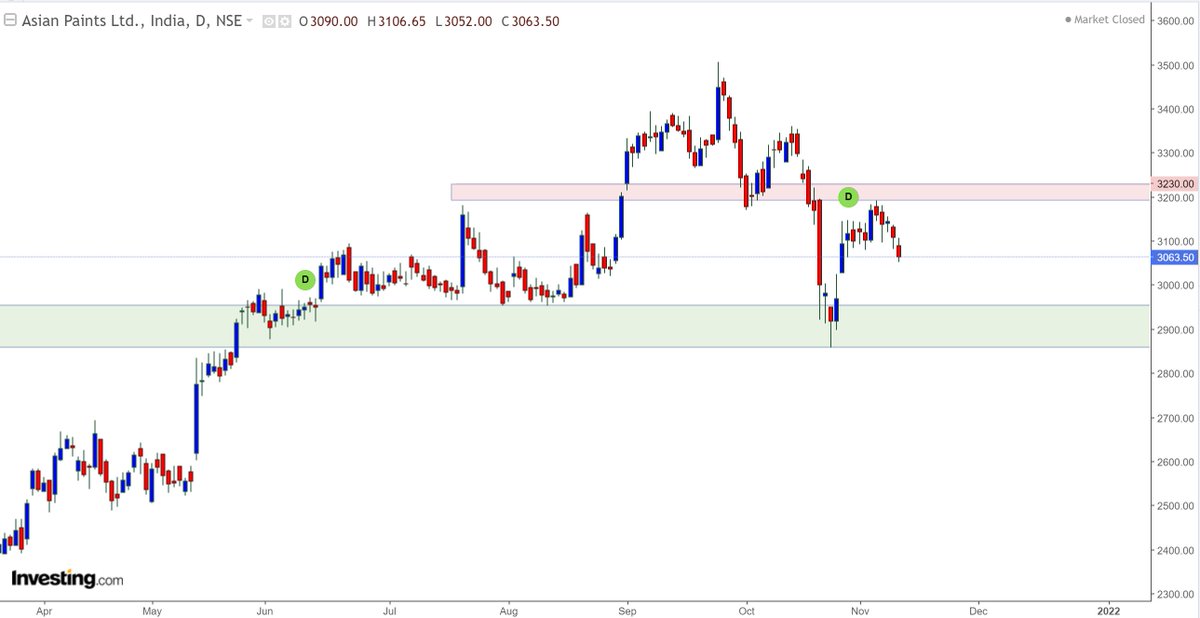
Asian Paints also at crucial support line, bulls desperately need a reversal here, else it'll go in hibernation..... pic.twitter.com/VTfaMfpHXs
— Professor (@DillikiBiili) October 21, 2021
More from Professor
Starting the Beginner’s Pathway thread for Fundamental Investing.
One Chadarmod on timeline posted that I’m giving gyan without having experience or expertise.
So I’ll begin with paying my portfolio performance tribute to these charlies.
https://t.co/GNM5SsNFNo
Fundamentals based investing can generate serious wealth as the most famous (rather infamous) Warren Buffett has shown.
In India also we have many success stories like @VijayKedia1 @Raamdeo R K Damani Rakesh Jhunjhunwala Late Chandrakant Sampat and many many more....
Though I can't stop mentioning that both Rakesh Jhunjhunwala and R K Damani were traders in their initial days.
Rakesh Jhunjhunwala still trades, he once said Traing is fun, its le fatafat, de fatafat
A lot of people (specially the beginners) buy stocks based on some friend's recommendation : XYZ le le, pukka chalega, maine bhi le rakha hai.
Few might have made money this way, but most do not. Why ?
There has to be a process.
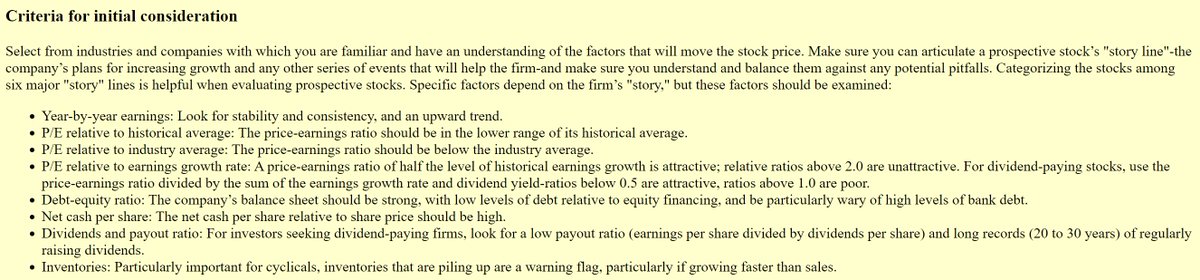
Fundamentals based investing need thorough analysis of the Business & Company.
Here is a preliminary checklist by the legendary investor Peter lynch
One Chadarmod on timeline posted that I’m giving gyan without having experience or expertise.
So I’ll begin with paying my portfolio performance tribute to these charlies.
https://t.co/GNM5SsNFNo
Sadda Haqq ! Aithe Rakhh......... pic.twitter.com/IH5q3v2gw9
— Professor (@DillikiBiili) October 5, 2021
Fundamentals based investing can generate serious wealth as the most famous (rather infamous) Warren Buffett has shown.
In India also we have many success stories like @VijayKedia1 @Raamdeo R K Damani Rakesh Jhunjhunwala Late Chandrakant Sampat and many many more....
Though I can't stop mentioning that both Rakesh Jhunjhunwala and R K Damani were traders in their initial days.
Rakesh Jhunjhunwala still trades, he once said Traing is fun, its le fatafat, de fatafat
A lot of people (specially the beginners) buy stocks based on some friend's recommendation : XYZ le le, pukka chalega, maine bhi le rakha hai.
Few might have made money this way, but most do not. Why ?
There has to be a process.
Fundamentals based investing need thorough analysis of the Business & Company.
Here is a preliminary checklist by the legendary investor Peter lynch
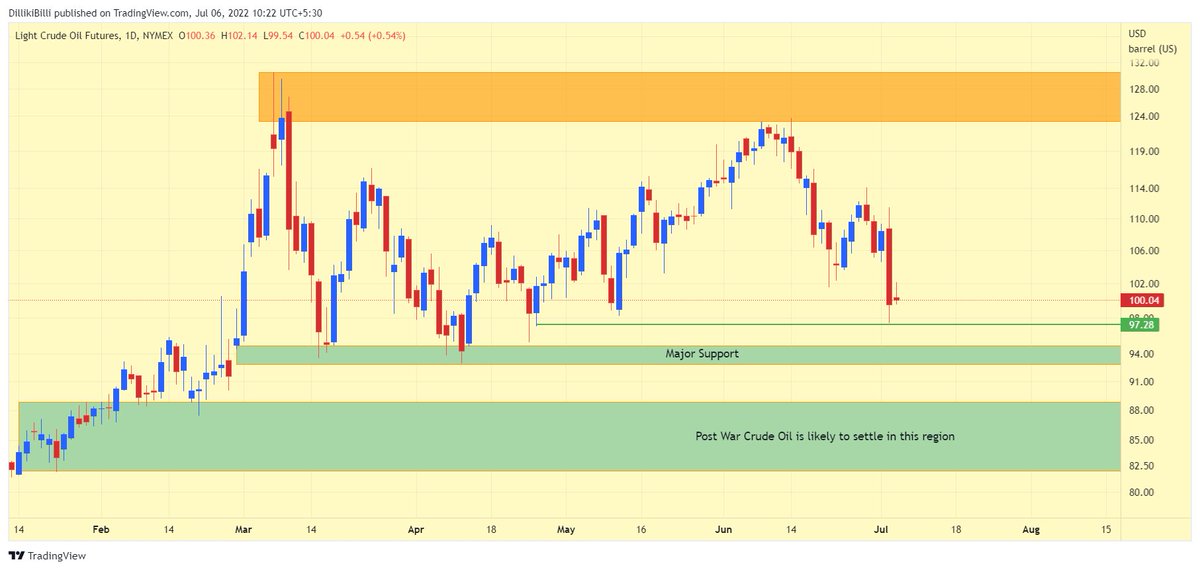
Crude Oil forming bottom at US$ 100 for now, which is a big psychological level.
Needs to break below this level for real impact. https://t.co/r5KoExzFKc
Needs to break below this level for real impact. https://t.co/r5KoExzFKc
NYMEX Crude Oil update !
— Professor (@DillikiBiili) July 1, 2022
Its not ready to come below US$ 100 which is a big psychological level ! Everytime it comes near that zone, it takes a bounce. https://t.co/xQ3dZZXNiu pic.twitter.com/7WS38JU6JF
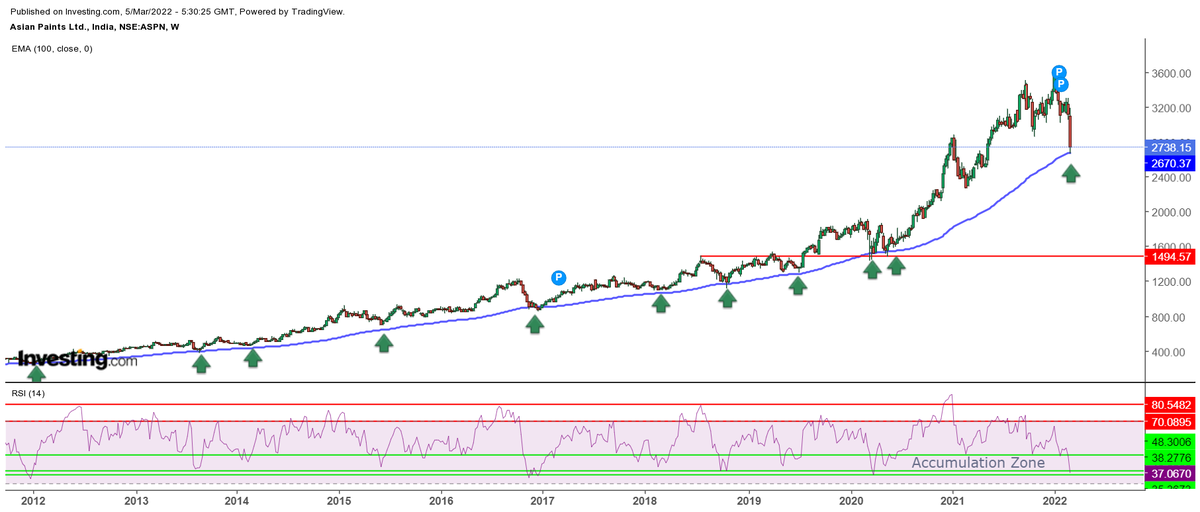
More pointers to help in identifying whether its accumulation or Distribution.
Lest some charlie jumps to point out, let me make it clear that I haven't invented anything in stock market, all my knowledge of stock market comes from old farts. Just my observation is my own. https://t.co/uHNw8tV4AO
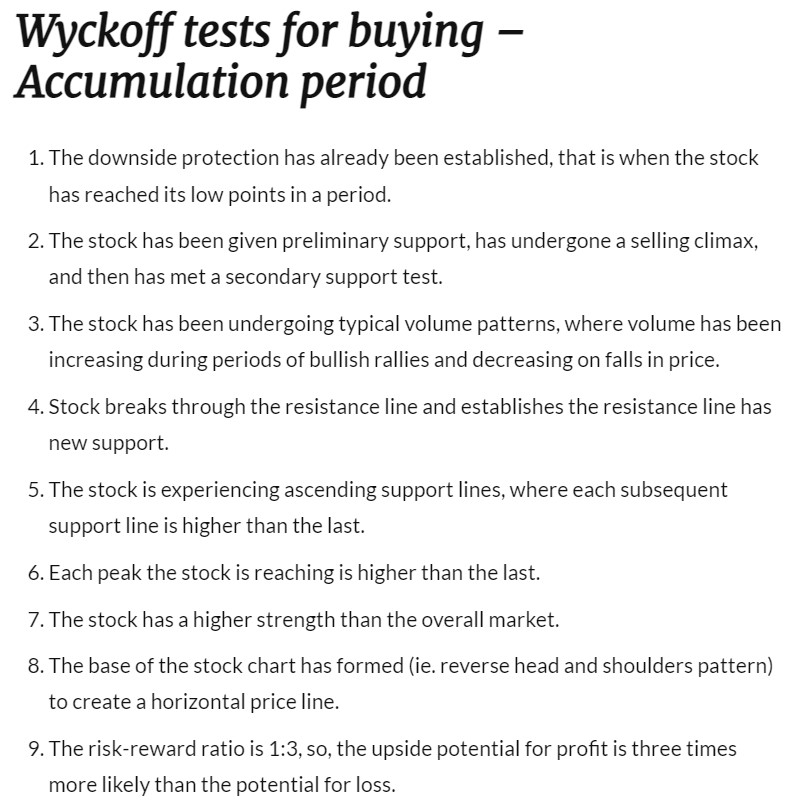
Lest some charlie jumps to point out, let me make it clear that I haven't invented anything in stock market, all my knowledge of stock market comes from old farts. Just my observation is my own. https://t.co/uHNw8tV4AO
Plz advice how to identify accumulation and distribution phase...... to me Both looks same
— VIVEK VAID (@bobvaid) February 12, 2022
OI Data reading seekh lo:
See Large OIl buildup kin strikes par hai and in between strikes data kaise move ho raha hai.
Thumb Rule:
Calls Reduction + Puts addition = Upthrust
Calls Addition + Put Reduction = Down move
Higher the Delta OI velocity, faster is the move.
See Large OIl buildup kin strikes par hai and in between strikes data kaise move ho raha hai.
Thumb Rule:
Calls Reduction + Puts addition = Upthrust
Calls Addition + Put Reduction = Down move
Higher the Delta OI velocity, faster is the move.
For Nifty Intraday Traders: As of now, this seems to be a buy on dip market and looks like there won't be any juicy trades on short side. Will update if data changes. https://t.co/PCIyyPld4A pic.twitter.com/ES3o4z60rY
— Professor (@DillikiBiili) March 11, 2022