
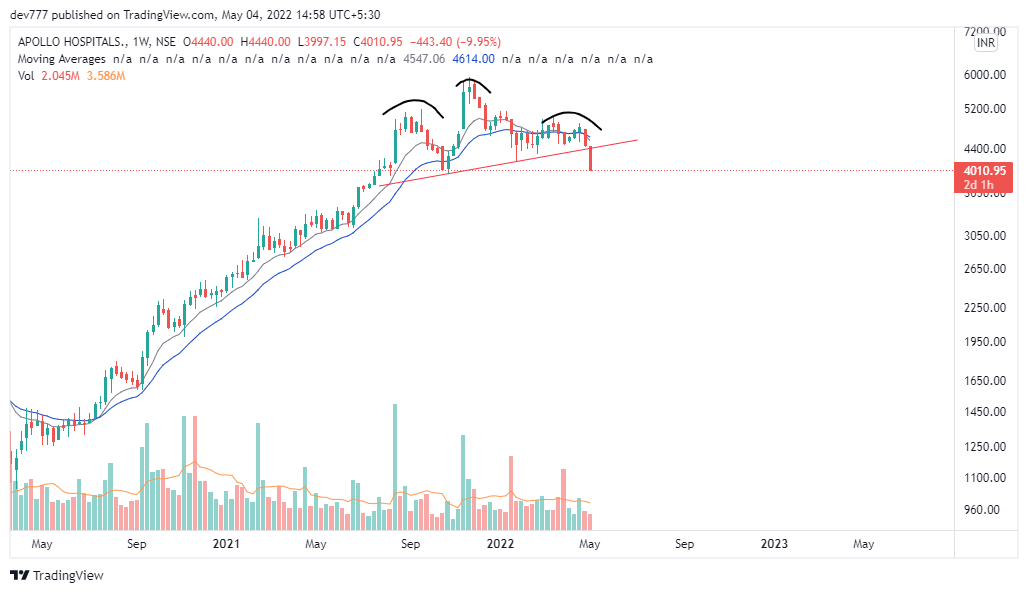
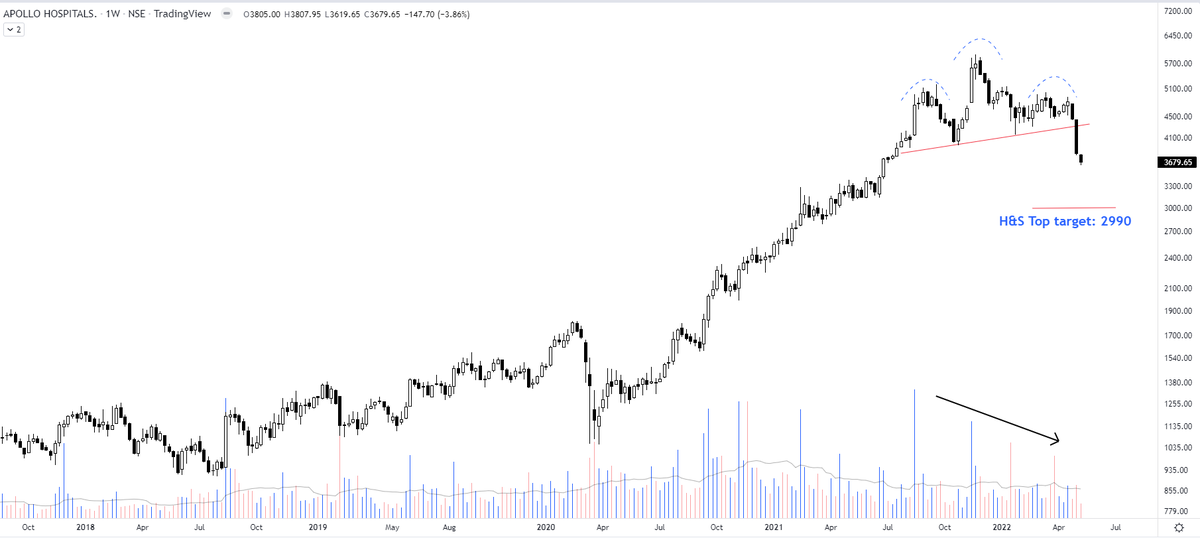
Apollo Hospitals - Another H&S top
There are many H&S top today
Looking at price action in many stocks - Welcome to bear markets fully the start of which was in Oct-Nov 21
More from EquiAlpha -MidTerm Momentum🐎🐎
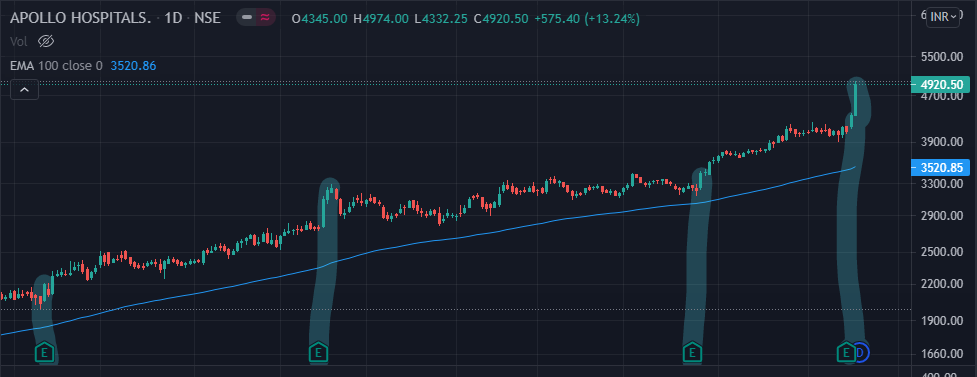
The other way to look at this is that..The stock went below 21 month EA in 2008 & 2020 crash
Something is happening really too bad and worst is yet to come for entire market !!
Something is happening really too bad and worst is yet to come for entire market !!
HDFC bank Monthly Chart :
— EquiAlpha -MidTerm Momentum\U0001f40e\U0001f40e (@equialpha) March 7, 2022
In last 20 years - Only 2 times the stock has gone below 21 month EMA as market. This seems the third time (Monthly close will confirm )
Don't know but something seems off !!
Lets check again on month end pic.twitter.com/9eeVfikdnU


More from Apollohospitals


You May Also Like


1/ Here’s a list of conversational frameworks I’ve picked up that have been helpful.
Please add your own.
2/ The Magic Question: "What would need to be true for you
3/ On evaluating where someone’s head is at regarding a topic they are being wishy-washy about or delaying.
“Gun to the head—what would you decide now?”
“Fast forward 6 months after your sabbatical--how would you decide: what criteria is most important to you?”
4/ Other Q’s re: decisions:
“Putting aside a list of pros/cons, what’s the *one* reason you’re doing this?” “Why is that the most important reason?”
“What’s end-game here?”
“What does success look like in a world where you pick that path?”
5/ When listening, after empathizing, and wanting to help them make their own decisions without imposing your world view:
“What would the best version of yourself do”?
Please add your own.
2/ The Magic Question: "What would need to be true for you
1/\u201cWhat would need to be true for you to\u2026.X\u201d
— Erik Torenberg (@eriktorenberg) December 4, 2018
Why is this the most powerful question you can ask when attempting to reach an agreement with another human being or organization?
A thread, co-written by @deanmbrody: https://t.co/Yo6jHbSit9
3/ On evaluating where someone’s head is at regarding a topic they are being wishy-washy about or delaying.
“Gun to the head—what would you decide now?”
“Fast forward 6 months after your sabbatical--how would you decide: what criteria is most important to you?”
4/ Other Q’s re: decisions:
“Putting aside a list of pros/cons, what’s the *one* reason you’re doing this?” “Why is that the most important reason?”
“What’s end-game here?”
“What does success look like in a world where you pick that path?”
5/ When listening, after empathizing, and wanting to help them make their own decisions without imposing your world view:
“What would the best version of yourself do”?