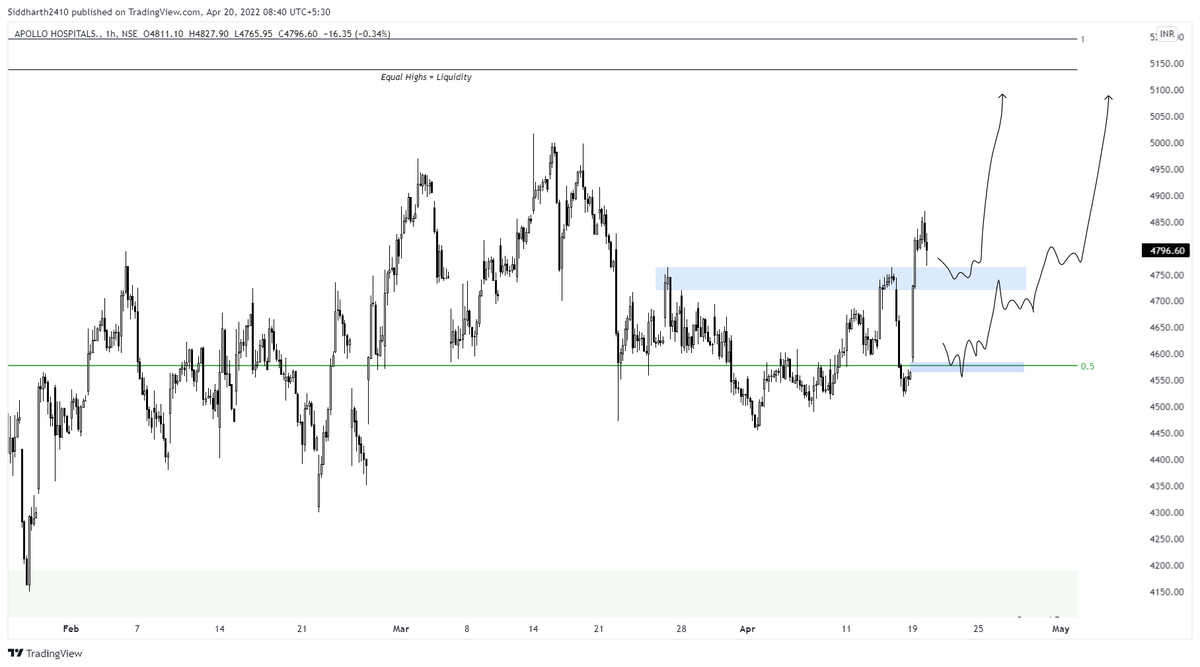
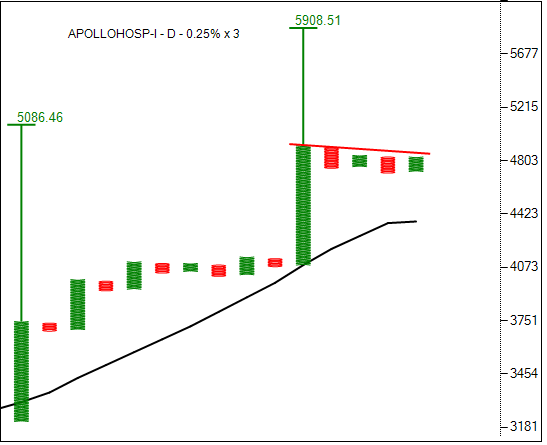
Apollo Hospitals is ready to breakout!

More from Indrazith Shantharaj
A Gap Open is a Big Headache for Intraday Traders.
Nowadays everyday market is opening with big gaps.
Solution?
Shifting to Stocks!
But How to Pick Good Stocks for Tomorrow's Trading?
Presenting 11 FREE Screeners to scan Stocks for the Next Trading Day!
Thread 🧵
(1/N)

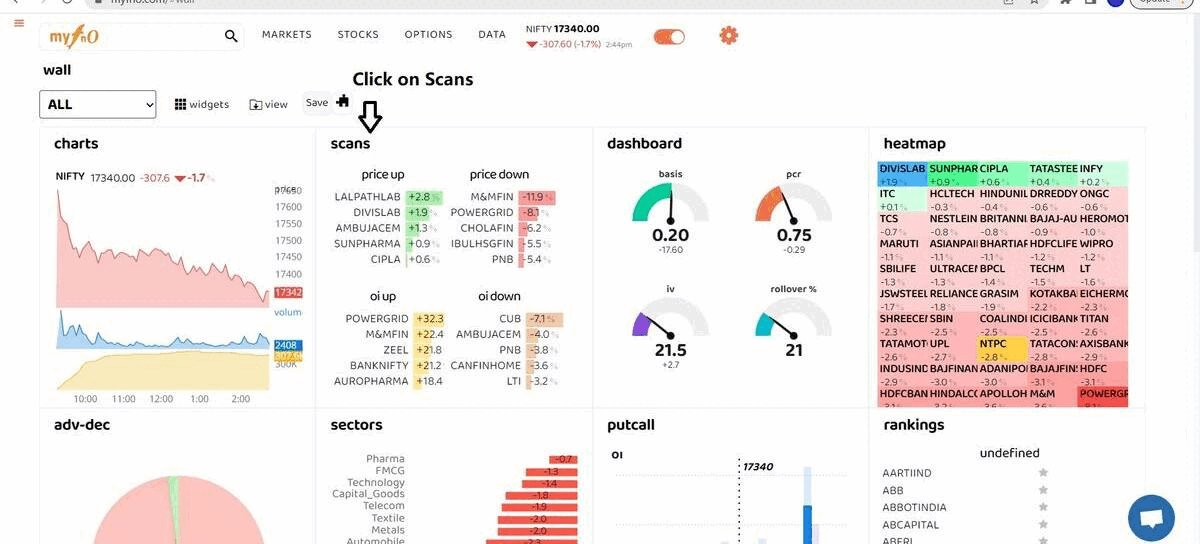
MYFNO - To Know the Stocks Which Received High and Low Open Interest (OI)
https://t.co/FURZDTArKK
(2/N)
Shortlist Bullish Momentum Stocks
This Screener shortlists all the bullish momentum stocks from NSE for the next day's trading (based on price action).
https://t.co/3teN7JLDMs
(3/N)
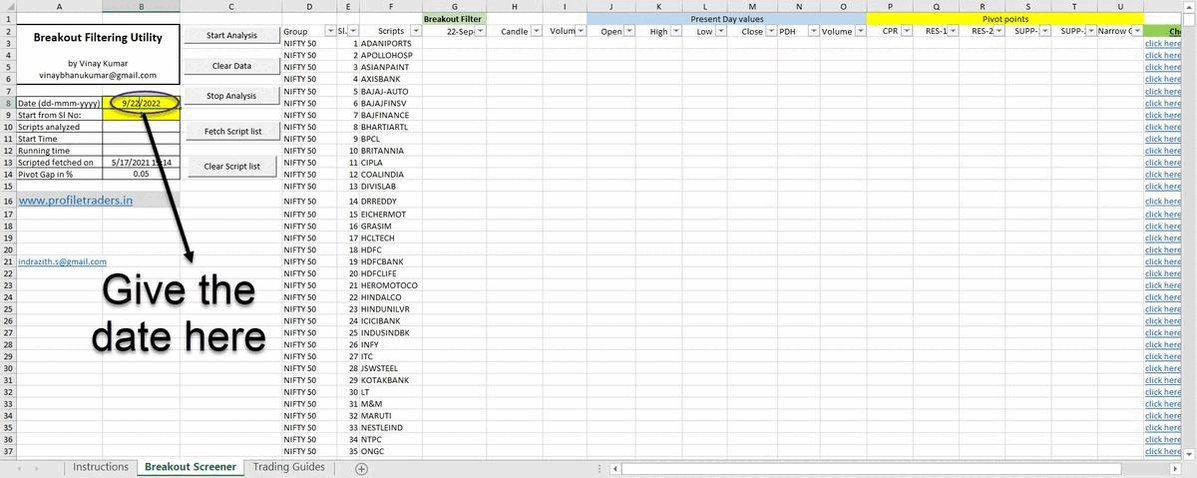
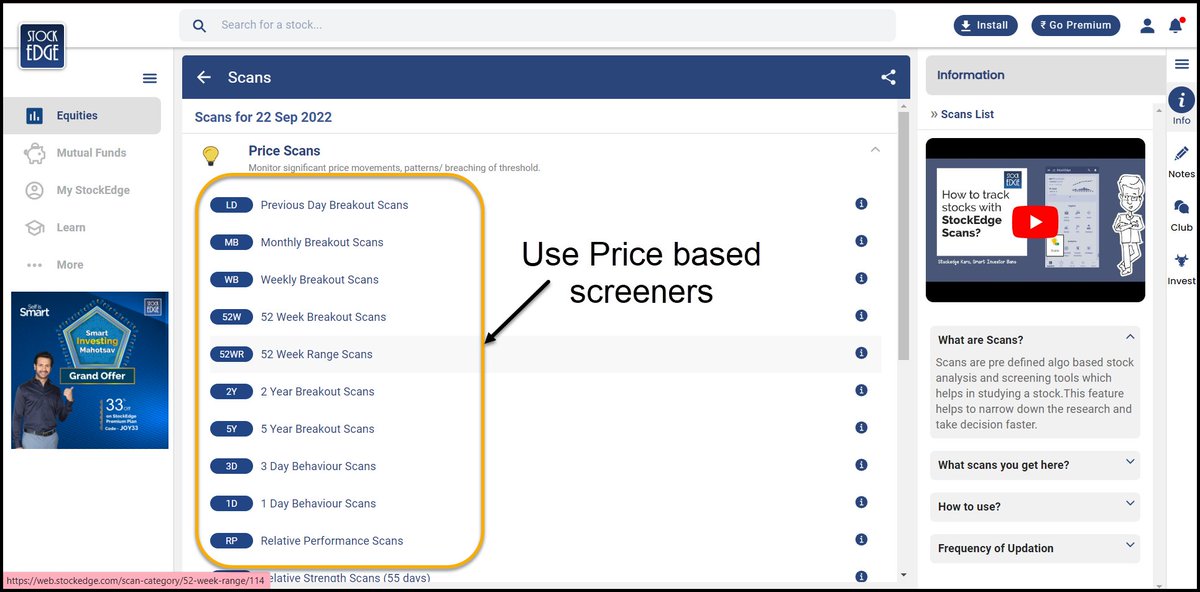
Screeners Based on Price (ex: Previous Day Breakout, Weekly Breakout, Monthly Breakout, etc.)
https://t.co/Y5naQIx967
(4/N)
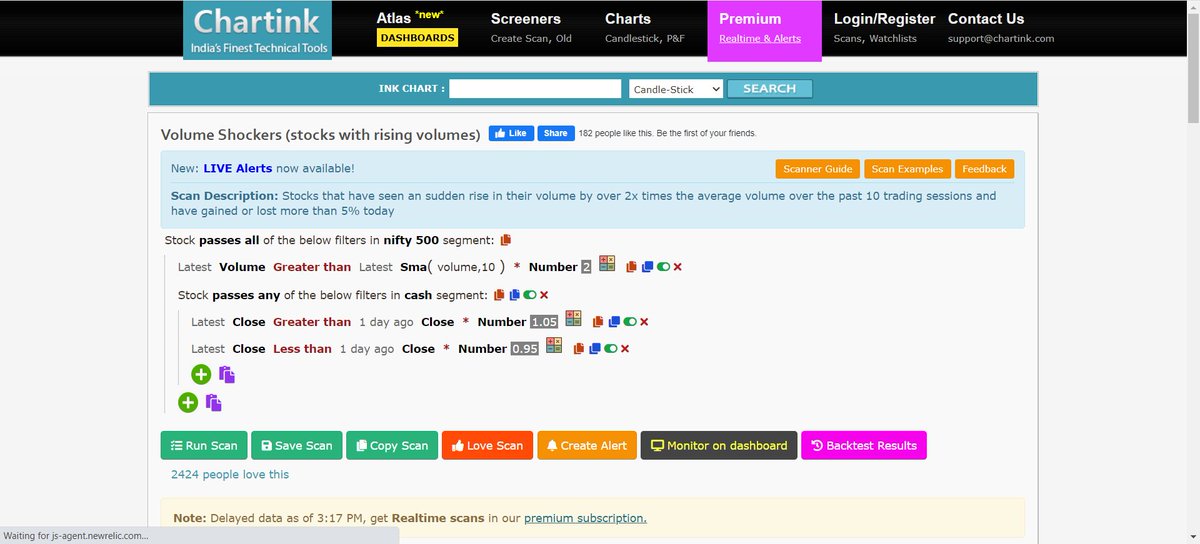
Volume Shockers - Stocks that received a huge volume
https://t.co/u9LTY5Yiir
(5/N)
Nowadays everyday market is opening with big gaps.
Solution?
Shifting to Stocks!
But How to Pick Good Stocks for Tomorrow's Trading?
Presenting 11 FREE Screeners to scan Stocks for the Next Trading Day!
Thread 🧵
(1/N)
MYFNO - To Know the Stocks Which Received High and Low Open Interest (OI)
https://t.co/FURZDTArKK
(2/N)
Shortlist Bullish Momentum Stocks
This Screener shortlists all the bullish momentum stocks from NSE for the next day's trading (based on price action).
https://t.co/3teN7JLDMs
(3/N)
Screeners Based on Price (ex: Previous Day Breakout, Weekly Breakout, Monthly Breakout, etc.)
https://t.co/Y5naQIx967
(4/N)
Volume Shockers - Stocks that received a huge volume
https://t.co/u9LTY5Yiir
(5/N)


More from Apollohospitals


This is way faster than I had thought. At 3170.
#APOLLOHOSP @ 2110 - Long Term Chart.
— Piyush Chaudhry (@piyushchaudhry) November 12, 2020
I see a fair possibility of the stock rising to 3500-5000 zone over next few years and an open possibility of the next zone of 5000-7500 as well.
Invalidation on break below Blue TL. pic.twitter.com/QJ5aY4eTT8