As someone who covered climate change a decade ago, I feel like the rest of the world is only just catching up to the following realities:
1. Avoiding truly epic amounts of climate change is technically feasible but economically and politically totally infeasible
Federal flood insurance and FEMA excepted of course, since that's backed by a government that seems content to subsidize rebuilding in the path of danger.
https://t.co/pIQUQmCt3p
More from All


How can we use language supervision to learn better visual representations for robotics?
Introducing Voltron: Language-Driven Representation Learning for Robotics!
Paper: https://t.co/gIsRPtSjKz
Models: https://t.co/NOB3cpATYG
Evaluation: https://t.co/aOzQu95J8z
🧵👇(1 / 12)
Videos of humans performing everyday tasks (Something-Something-v2, Ego4D) offer a rich and diverse resource for learning representations for robotic manipulation.
Yet, an underused part of these datasets are the rich, natural language annotations accompanying each video. (2/12)
The Voltron framework offers a simple way to use language supervision to shape representation learning, building off of prior work in representations for robotics like MVP (https://t.co/Pb0mk9hb4i) and R3M (https://t.co/o2Fkc3fP0e).
The secret is *balance* (3/12)
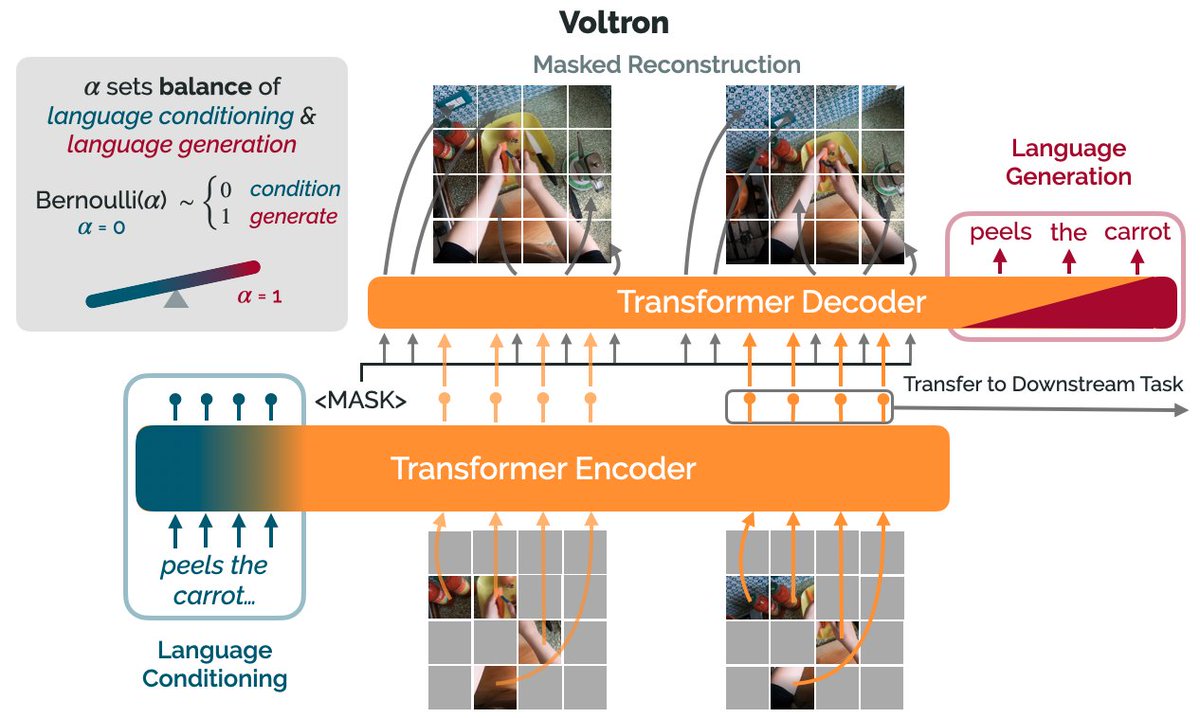
Starting with a masked autoencoder over frames from these video clips, make a choice:
1) Condition on language and improve our ability to reconstruct the scene.
2) Generate language given the visual representation and improve our ability to describe what's happening. (4/12)
By trading off *conditioning* and *generation* we show that we can learn 1) better representations than prior methods, and 2) explicitly shape the balance of low and high-level features captured.
Why is the ability to shape this balance important? (5/12)
Introducing Voltron: Language-Driven Representation Learning for Robotics!
Paper: https://t.co/gIsRPtSjKz
Models: https://t.co/NOB3cpATYG
Evaluation: https://t.co/aOzQu95J8z
🧵👇(1 / 12)
Videos of humans performing everyday tasks (Something-Something-v2, Ego4D) offer a rich and diverse resource for learning representations for robotic manipulation.
Yet, an underused part of these datasets are the rich, natural language annotations accompanying each video. (2/12)
The Voltron framework offers a simple way to use language supervision to shape representation learning, building off of prior work in representations for robotics like MVP (https://t.co/Pb0mk9hb4i) and R3M (https://t.co/o2Fkc3fP0e).
The secret is *balance* (3/12)
Starting with a masked autoencoder over frames from these video clips, make a choice:
1) Condition on language and improve our ability to reconstruct the scene.
2) Generate language given the visual representation and improve our ability to describe what's happening. (4/12)
By trading off *conditioning* and *generation* we show that we can learn 1) better representations than prior methods, and 2) explicitly shape the balance of low and high-level features captured.
Why is the ability to shape this balance important? (5/12)
You May Also Like


1/OK, data mystery time.
This New York Times feature shows China with a Gini Index of less than 30, which would make it more equal than Canada, France, or the Netherlands. https://t.co/g3Sv6DZTDE
That's weird. Income inequality in China is legendary.
Let's check this number.
2/The New York Times cites the World Bank's recent report, "Fair Progress? Economic Mobility across Generations Around the World".
The report is available here:
3/The World Bank report has a graph in which it appears to show the same value for China's Gini - under 0.3.
The graph cites the World Development Indicators as its source for the income inequality data.

4/The World Development Indicators are available at the World Bank's website.
Here's the Gini index: https://t.co/MvylQzpX6A
It looks as if the latest estimate for China's Gini is 42.2.
That estimate is from 2012.
5/A Gini of 42.2 would put China in the same neighborhood as the U.S., whose Gini was estimated at 41 in 2013.
I can't find the <30 number anywhere. The only other estimate in the tables for China is from 2008, when it was estimated at 42.8.
This New York Times feature shows China with a Gini Index of less than 30, which would make it more equal than Canada, France, or the Netherlands. https://t.co/g3Sv6DZTDE
That's weird. Income inequality in China is legendary.
Let's check this number.
2/The New York Times cites the World Bank's recent report, "Fair Progress? Economic Mobility across Generations Around the World".
The report is available here:
3/The World Bank report has a graph in which it appears to show the same value for China's Gini - under 0.3.
The graph cites the World Development Indicators as its source for the income inequality data.
4/The World Development Indicators are available at the World Bank's website.
Here's the Gini index: https://t.co/MvylQzpX6A
It looks as if the latest estimate for China's Gini is 42.2.
That estimate is from 2012.
5/A Gini of 42.2 would put China in the same neighborhood as the U.S., whose Gini was estimated at 41 in 2013.
I can't find the <30 number anywhere. The only other estimate in the tables for China is from 2008, when it was estimated at 42.8.