🟢9ema is applied on the blue line which results in the creation of an orange line which is also called the signal line
🟢Histogram is plotted by taking the difference between the blue and orange line


1. Let's start option selling learning.
— Mitesh Patel (@Mitesh_Engr) February 10, 2019
Strangle selling. ( I am doing mostly in weekly Bank Nifty)
When to sell? When VIX is below 15
Assume spot is at 27500
Sell 27100 PE & 27900 CE
say premium for both 50-50
If bank nifty will move in narrow range u will get profit from both.
Few are selling 20-25 Rs positional option selling course.
— Mitesh Patel (@Mitesh_Engr) November 3, 2019
Nothing big deal in that.
For selling weekly option just identify last week low and high.
Now from that low and high keep 1-1.5% distance from strike.
And sell option on both side.
1/n
Sold 29200 put and 30500 call
— Mitesh Patel (@Mitesh_Engr) April 12, 2019
Used 20% capital@44 each
Already giving more than 2% return in a week. Now I will prefer to sell 32500 call at 74 to make it strangle in equal ratio.
— Mitesh Patel (@Mitesh_Engr) February 7, 2020
To all. This is free learning for you. How to play option to make consistent return.
Stay tuned and learn it here free of cost. https://t.co/7J7LC86oW0
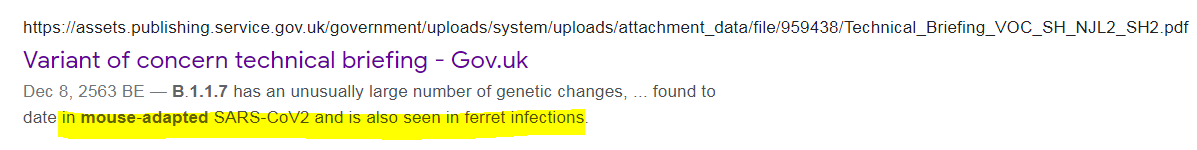
1. From Day 1, SARS-COV-2 was very well adapted to humans .....and transgenic hACE2 Mice
— Billy Bostickson \U0001f3f4\U0001f441&\U0001f441 \U0001f193 (@BillyBostickson) January 30, 2021
"we generated a mouse model expressing hACE2 by using CRISPR/Cas9 knockin technology. In comparison with wild-type C57BL/6 mice, both young & aged hACE2 mice sustained high viral loads... pic.twitter.com/j94XtSkscj
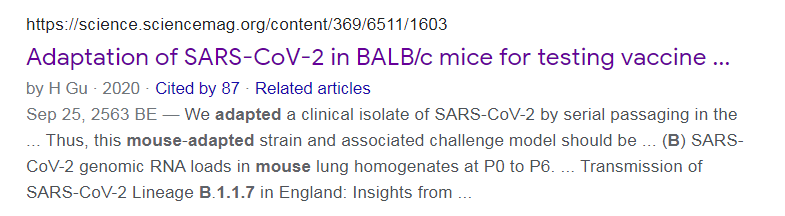
1. High Probability of serial passaging in Transgenic Mice expressing hACE2 in genesis of SARS-COV-2!
— Billy Bostickson \U0001f3f4\U0001f441&\U0001f441 \U0001f193 (@BillyBostickson) January 2, 2021
2 papers:
Human\u2013viral molecular mimicryhttps://t.co/irfH0Zgrve
Molecular Mimicryhttps://t.co/yLQoUtfS6s https://t.co/lsCv2iMEQz