2 / n
Why this additional info important to the trader?
Trader is now
1. Closer to the actual market happenings
2. Gets an insight to the candle
3. Receives in depth market information in real-time
4. Can see the volume on each price level separated in buyers and sellers ...
3/n
5. Can discover price and volume patterns that cannot be seen with a regular candle chart
6. Can see how the buy and sell orders affect the price
7. Better assessment of whether the market will continue its trend
More self-confidence when trading...
4/n
Most Common Order Flow Chart Types
1. Volume Order Flow Chart
2. Bid x Ask Order Flow Chart
3. Delta Order Flow Chart
5/n
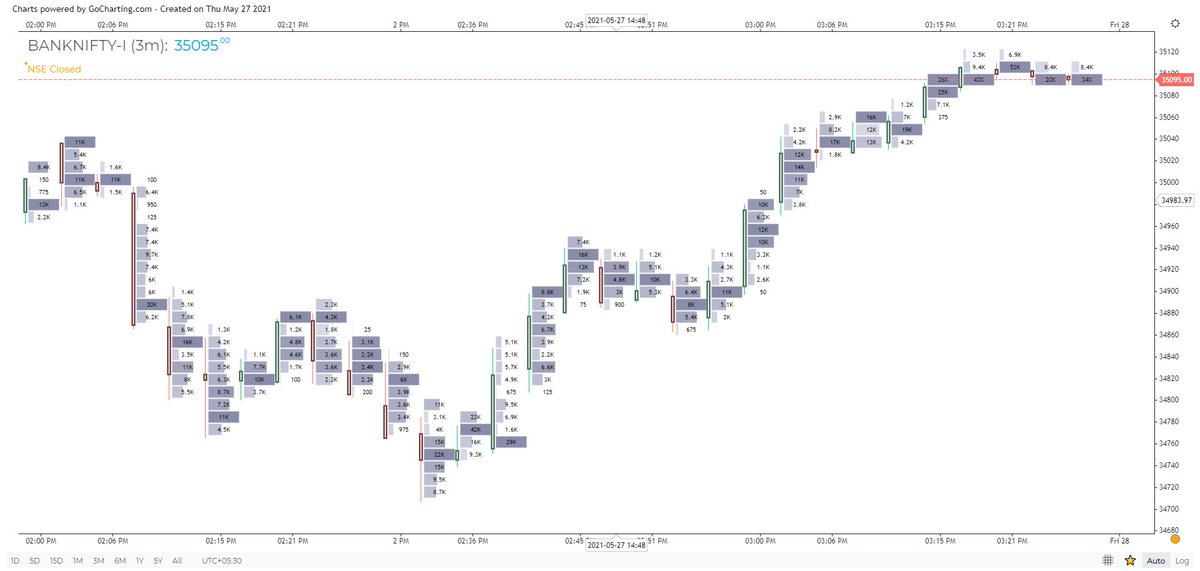
Volume Orderflow Chart
Basically this gives you the Volume Profile of every Candle
6/n
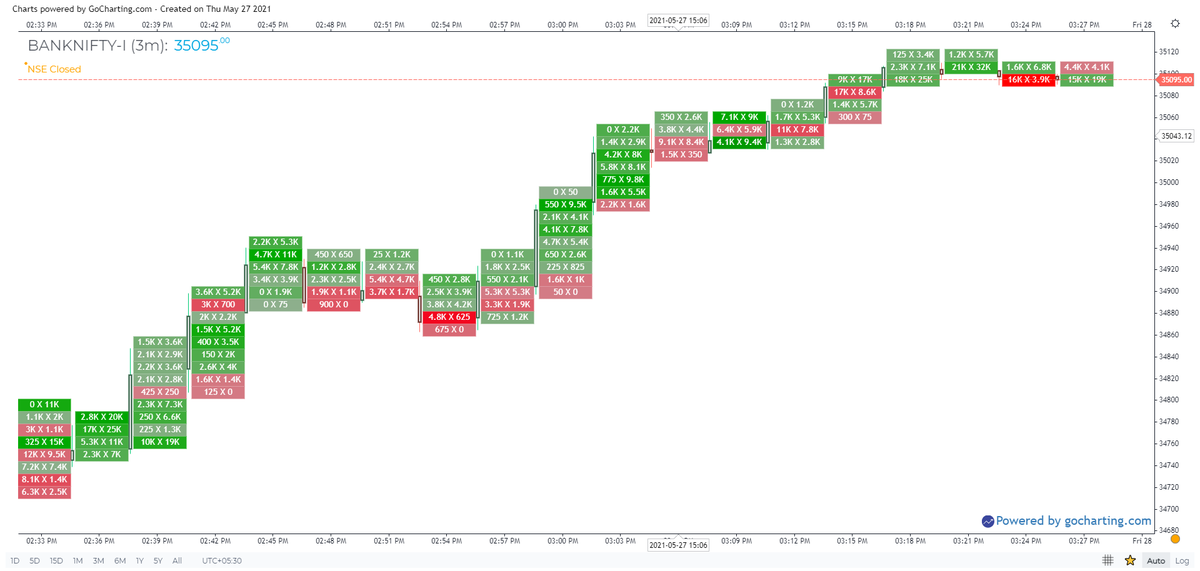
Bid x Ask Order Flow Chart
This order flow chart type splits the total volume into the seller and buyer side. It illustrates the volume traded on each side a certain price level.
7/n
The bid x ask order flow provides overview of how the volume is traded at a certain price and whether it has been traded more on the buyer or seller side. Helps in identifying a change in momentum, market pressure and order absorption
8/n
Each bar brick is color coded based on Delta.
Delta = Buy Volume - Sell Volume
Green = + Delta (Buy Volume > Sell Volume)
RED = - Delta (Buy Volume < Sell Volume)
9/n
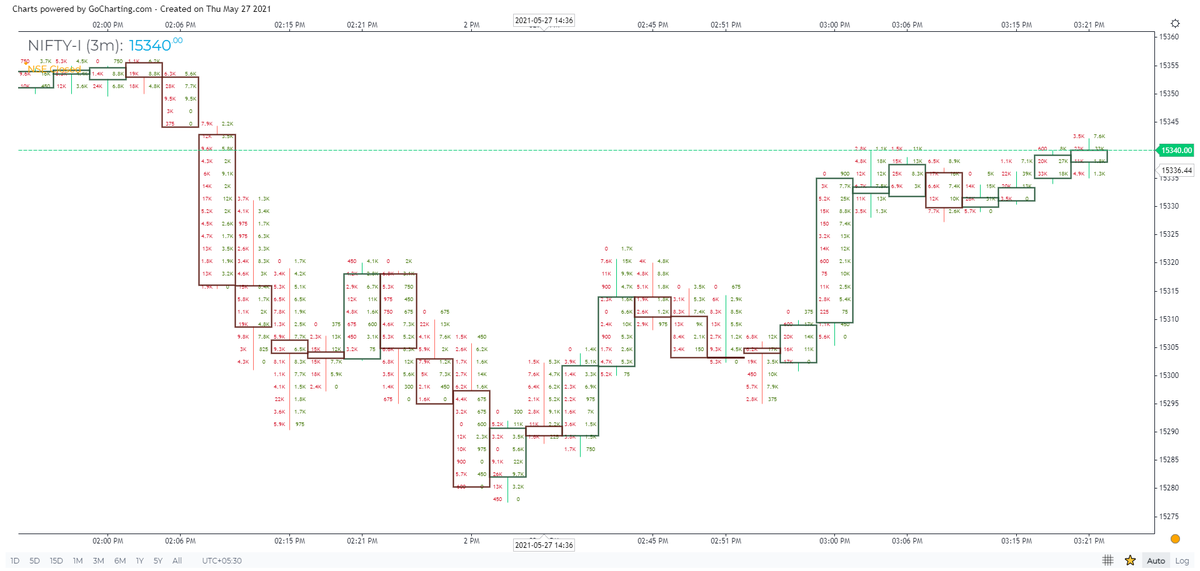
Another popular variation is where the sellers are on the left side of the candle and buyers on the right side
10/n
Delta Order Flow Chart
Chart illustrates difference between buy and sell market orders. Delta is shown in +ve or -ve. +ve delta illustrates there are were more aggressive buyers active and, in contrast, a -ve delta illustrates more aggressive sellers were active.
11/n
Delta order flow chart type provides an opportunity to measure the aggressive buying and selling pressure at a price level and indicates which side is more aggressive - buyers or sellers.
Popular Order Flow Chart Combinations
Order flow charts can also be combined in various ways to have multiple order flow information in one chart.
Bid x Ask Order Flow + Volume Combo
Bid x Ask Order Flow + Profile Combo
Bid x Ask Order Flow + Delta etc.