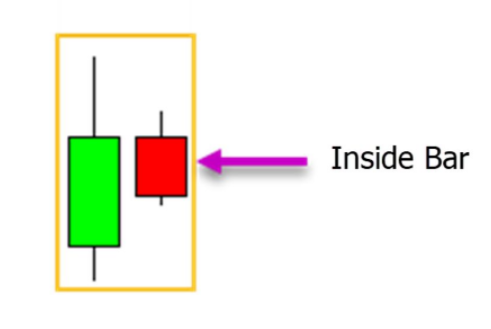
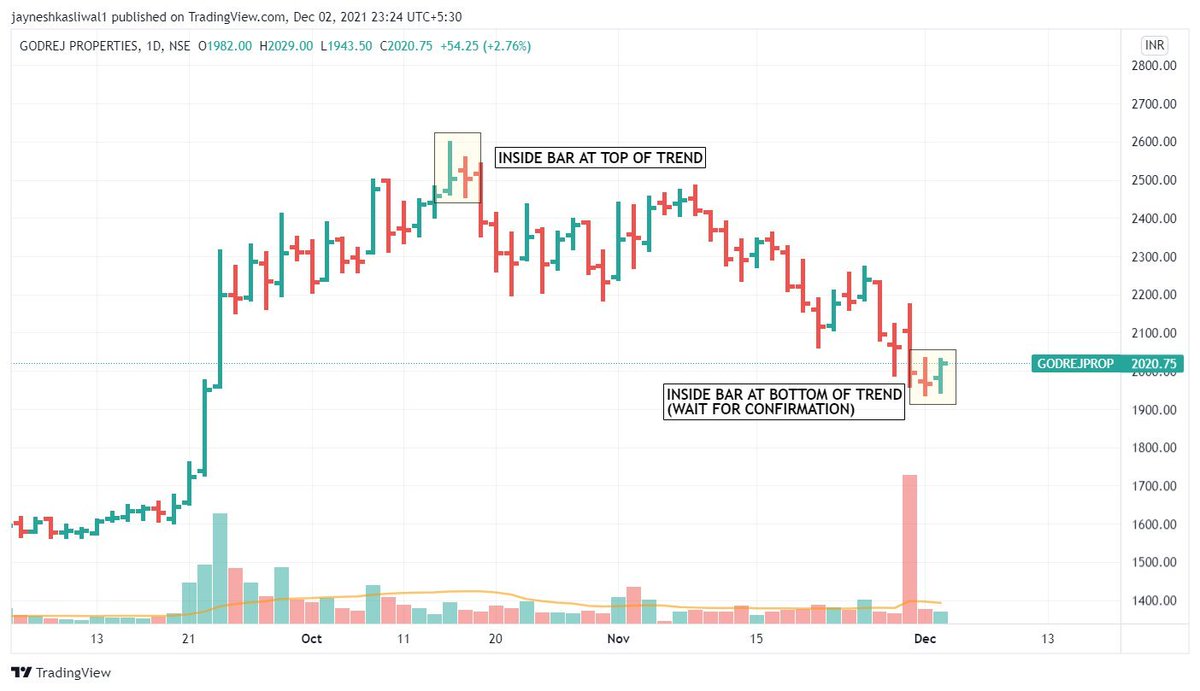
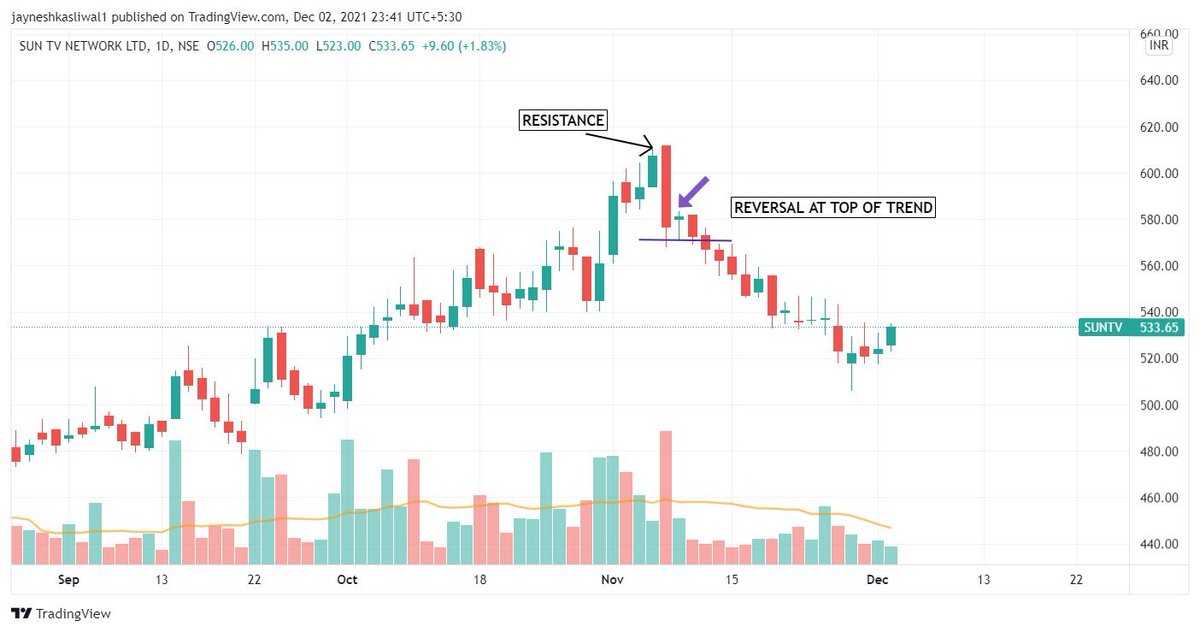
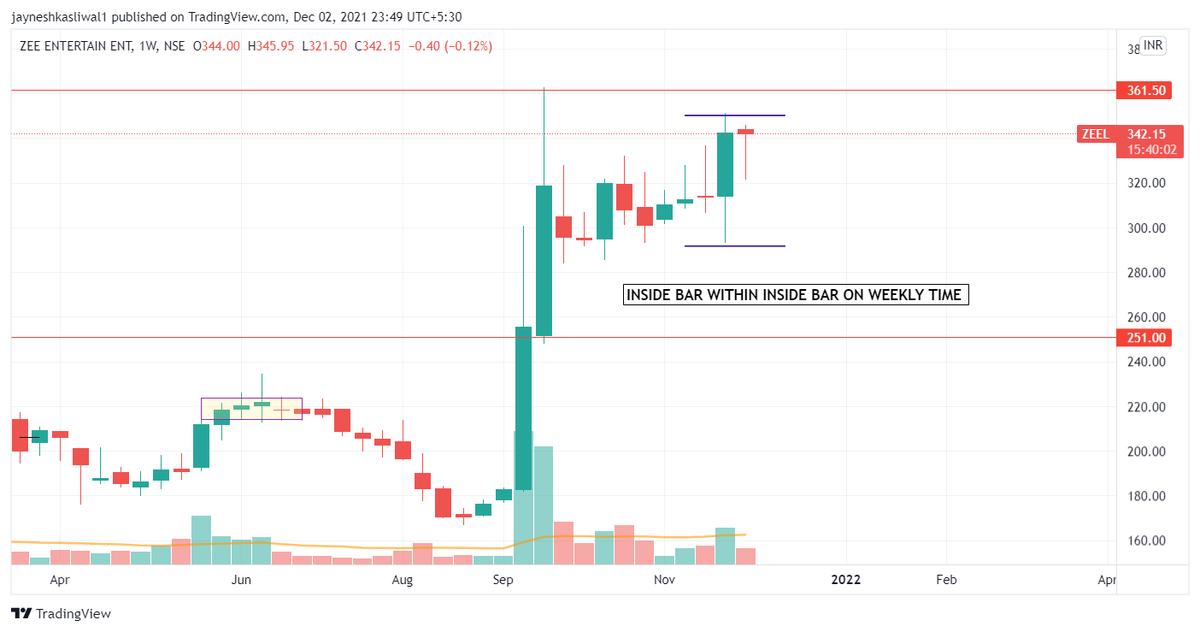
The inside bar pattern is a one candlestick pattern where price forms completely within the previous candlestick.
For an IB to be considered valid both the high and the low of the
candlestick or need to be completely inside the previous candle
2/n


Drive Link for
— JayneshKasliwal (@JayneshKasliwal) November 5, 2021
Custom Made Pdfs on
1. Trading Strategies
2. Stock Selection
3. Tradingview Free Tutorial
4. Psychology https://t.co/9ukwfjLDYT
Retweet Share !@kuttrapali26 @MarketScientist @AmitabhJha3
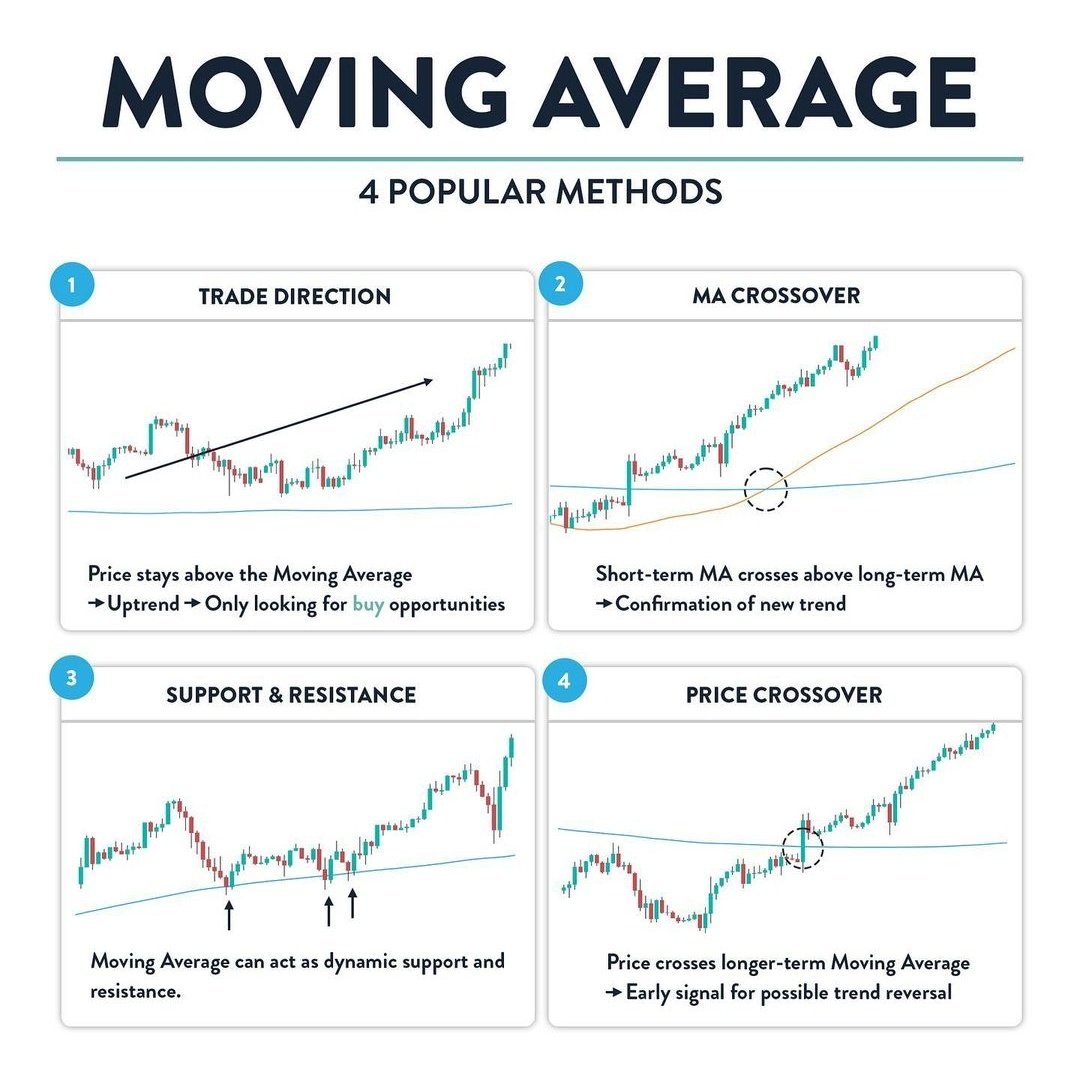
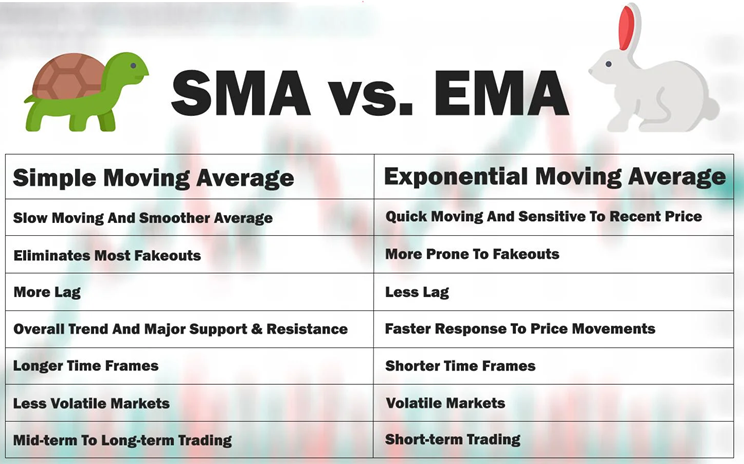
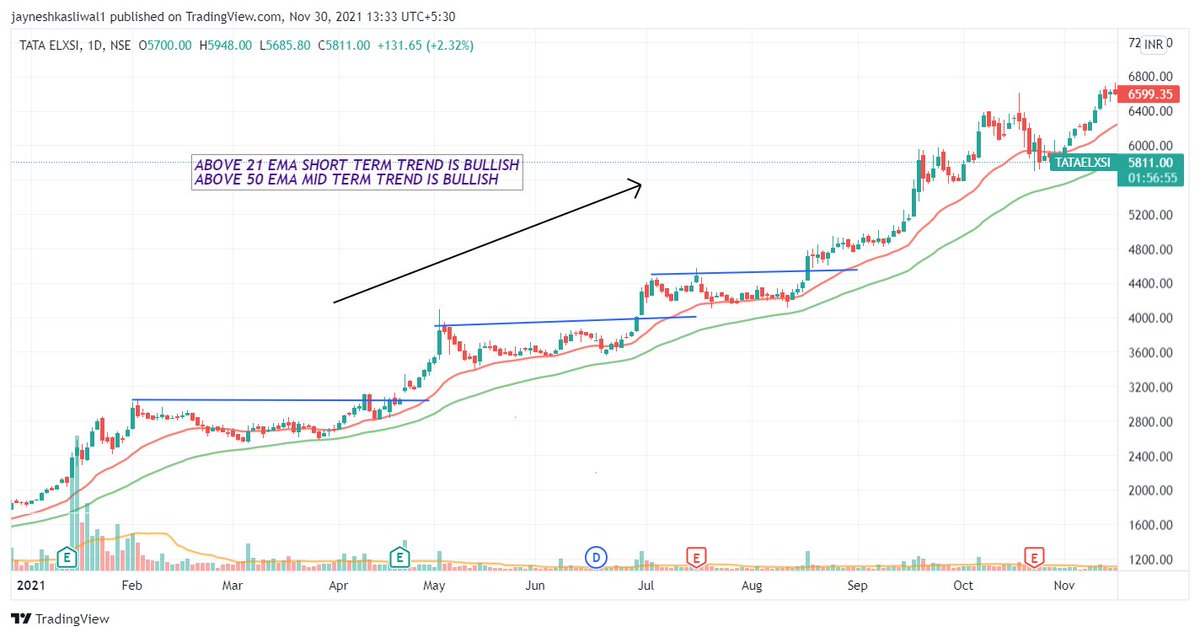
ULTIMATE GUIDE TO 21 and 200 Moving Average
— JayneshKasliwal (@JayneshKasliwal) November 14, 2021
SUNDAY THREAD \U0001f516
A trend Following System That will Help You Improve Trading immensely.
RETWEET AND SHARE \U0001f504@kuttrapali26 @AmitabhJha3 #stocks #StockMarket
1/n
1. From Day 1, SARS-COV-2 was very well adapted to humans .....and transgenic hACE2 Mice
— Billy Bostickson \U0001f3f4\U0001f441&\U0001f441 \U0001f193 (@BillyBostickson) January 30, 2021
"we generated a mouse model expressing hACE2 by using CRISPR/Cas9 knockin technology. In comparison with wild-type C57BL/6 mice, both young & aged hACE2 mice sustained high viral loads... pic.twitter.com/j94XtSkscj
1. High Probability of serial passaging in Transgenic Mice expressing hACE2 in genesis of SARS-COV-2!
— Billy Bostickson \U0001f3f4\U0001f441&\U0001f441 \U0001f193 (@BillyBostickson) January 2, 2021
2 papers:
Human\u2013viral molecular mimicryhttps://t.co/irfH0Zgrve
Molecular Mimicryhttps://t.co/yLQoUtfS6s https://t.co/lsCv2iMEQz