Market has a tendency to fill gap where no trading has took place.
Normal gap always fill up.
Gaps generally indicates breakout or breakdowns that happens due to liquidity problems,sudden change in fundamentals or sentiments
(2/n)
They occur in daily chart frequently and rarely occurs in weekly and monthly charts
Before we get into different types of gap formation here is a chart showing a gap so that you may know what we are talking about
A gap is formed during uptrend(price moving up)
(3/n)
Here is another chart where you can see the gap is being filled after it is made
This are common and may happen regularly in smaller timeframes
(4/n)
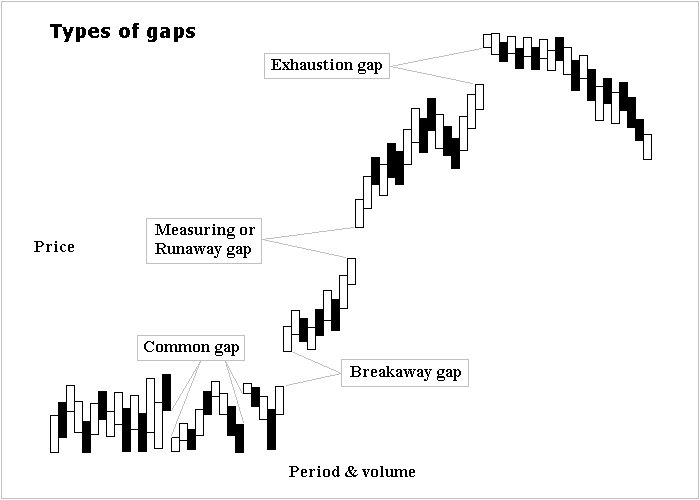
Now let us categorize gaps into 4 types according to technical analysis:
1)Common Gap
2)Breakaway Gap
3)Runaway Gap
4)Exhaustion Gap
We will understand each gap deeply why it is formed and the psychology behind each
Here is a chart showing all the 4 gaps together
(5/n)
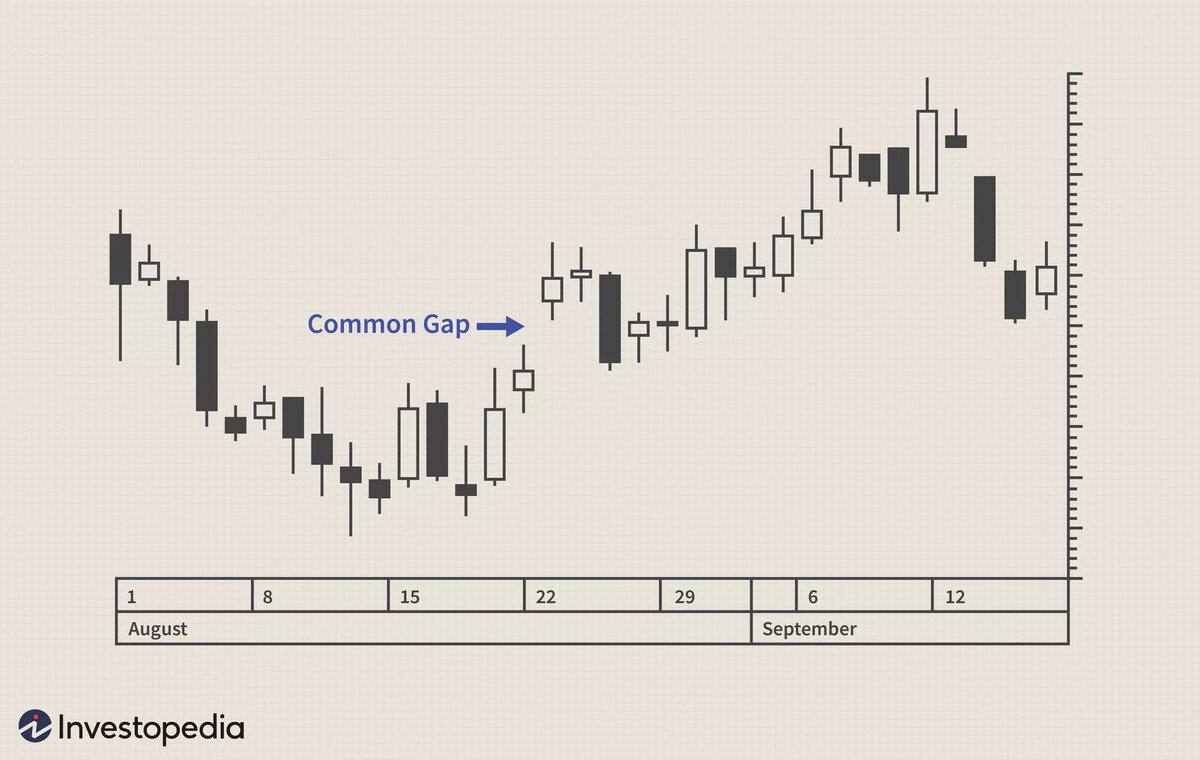
1)Common Gap
This gaps are also referred to as trading gap and are really uneventful which naturally happens everyday so its common.
Congestion area create this gaps and notice after gap up generally price moves to beginning of the gap.
(6/n)
They are filled easily for example a news of ex dividend can create this gap supported with low volume in next trading days and may take few days or week to fill it
Here is a chart showing common gap that is filled in next 2 days
Next gaps are actually interesting 😃
(7/n)
2)Breakaway Gap
This gaps are formed when price is breaking any trading range for example major support or resistance area in congestion area
A congestion area is just a price range where the market has traded for some period of time or weeks.
Check this chart
(8/n)
The area near the top is resistance and near the bottom is support. Thereby to break out this areas either requires more buyers then seller or viceversa
Volume should pick up significantly,for not only increased enthusiasm but people sitting on wrong side to cover position
(9/n)
Do not go with the trap that this gap may be filled easily rather participate with the new trend that is created by either breakout or breakdown
Sometimes it may take 2-3 years to fill this gap(noticed in few stocks)
(10/n)
3)Runaway Gaps
They are also called measuring gaps and are best described as gaps that are caused by increased interest in the stock
This gaps are created in almost panic or satisfaction scenarios where volume comes during and after the gap
(11/n)
Increase of interest happens sudden by those who has missed to buy in the initial rally and waited for retracement levels to buy but it does not come back and so it gaps up previous days closing
News based action make this gaps generally(govt policy changes,results,etc)
(12/n)
No support or resistance areas are broken as this gaps are created while the stock is moving in any trend up or down so its a run away gap.They are also not filled easily
This chart is showing a runaway gap with huge volume
(13/n)
4)Exhaustion Gaps
This gaps are created near any major top or bottom basically near the end of any major up or downtrend
A pattern is formed after this gap that reverses the trend with huge volume and also marks the end of previous trend
(14/n)
One can mistaken this for runaway if they do not see the exceptionally high volume
This gap are filled easily as price reverse their trend
Volume increases more after breakdown or breakout
In the chart notice there was one more day of trading after which stock plunged down
(15/n)
Conclusion:
There is an old saying that the market abhors a vacuum and all gaps will be filled
While this may be true for common or exhaustion gap but waiting for runaway gaps to be filled can be devastating
(16/n)
Gaps are significant development in price action and chart analysis thereby should not be ignored
Retweet and follow so that other people know an important aspect of chart and trade accordingly ✍️
All the best 🔥
You can check my other threads in pinned tweet section
(17/n)