SRI KUMARIAMMAN, KANYAKUMARI (TN)
#bharatmandir #navratri2021
Created by Maharshi Parasurama and also one among the 108 Shakthi Peethas in the world. The name Kanyakumari stands for Kanya(Virgin) and Kumari(girl).
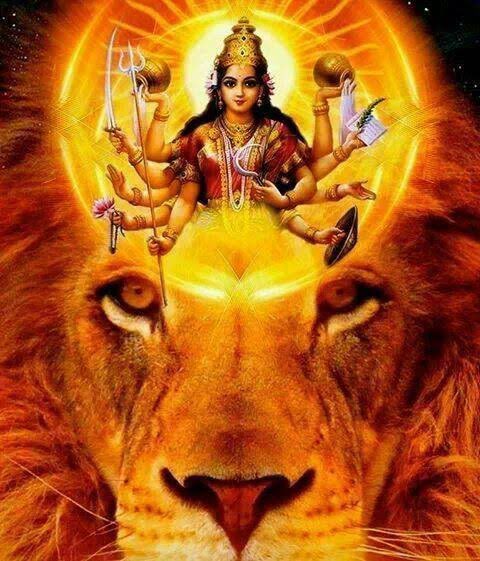
Devi took this form to vanquish the demon Banasura
@GunduHuDuGa
Once, Banasura(grand son of Mahabali) obtained a boon from Shiva that he could be vanquished only by a virgin.
So, Devi took the form of a kumari and started meditating with the desire to marry Shiva at Suchindram.
Pleased Shiva fixed the midnight hour for marriage with Devi.
Devarshi Narada knew that the marriage would end the chance of killing Banasura. So, he assumed the form of a cock and crowed. Shiva returned back to Suchindram thinking that it was dawn.
Angered, Devi cursed that all food and articles meant for wedding turn into sand and shells
When Banasura heard about Devi’s beauty, he tried to take her by force. Devi, then, killed him and granted the wish of Devas to remain there always protecting them.
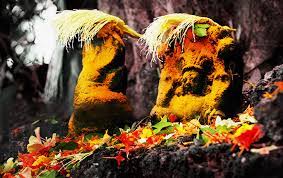
The murti of Devi stands with a rosary in hand. Her diamond nose-ring is said to be visible even from the sea.
Once an ancient mariner mistook it for a lighthouse and sailing towards it, his ship wrecked upon the Kanya Kumari rocks. In order to prevent such a tragedy from happening again, the eastern door of the shrine is opened only on five special occasions throughout the year.