Over the summer, we tracked the re-accumulation phase, as supply flowed to strong hands, made possible by a slew of new supply-related metrics.
One of the early red flags I'll be looking for is a sharp decline in illiquid supply shock ratio and highly liquid supply shock ratio.
Another new metric created over summer is the LTH supply shock ratio. After reaching new highs (macro supply shock) it appears we are starting to top out in the metric, usual bull market behavior.
But how can we utilize this moving forward?
We can apply trendlines to the LTH supply shock ratio.
Note that we've generally found macro bottoms along the lower trendline of the ratio, and tops around the upper trendline.
Would be looking for expansion towards that upper trendline to start getting cautious.
Can also look at the Supply Delta, created by
@caprioleio, which uses 720-day (2 year) moving averages to smooth out and capture signals from the difference between LTH/STH dynamics.
Next up we have a metric created by the bro
@DylanLeClair_ that looks at the cost basis (realized price) of both LTHs and STHs. By taking the ratio of the two, we get clear accumulation and de-risking zones. (shown by green and red lines)
We're currently far from overheated.
Another note on realized price: We can look at MVRV, a ratio of market value to realized value. Going a step further to z-score (adjust for volatility) the ratio, we have nice accumulation/derisking zones. Currently "luke-warm".
We can take a ratio of liveliness (coin days created/destroyed) and realized price. (h/t
@dorinvesting) We can then take the ratio of those two things, divide that by price, and get the blue line below. This also gives us nice accumulation/derisking zones. Warming up.
Last note on realized price. We can look at a ratio between delta cap/price (difference between average cap and realized) and realized cap/price.
The metric has historically made higher highs, something we've yet to do.
Another great metric is Reserve Risk, created by
@hansthered. RR is defined as price / hodl bank. It is used to assess the confidence of holders relative to the price. When confidence is high and price is low, reserve risk is low. (and vice versa)
Lukewarm.
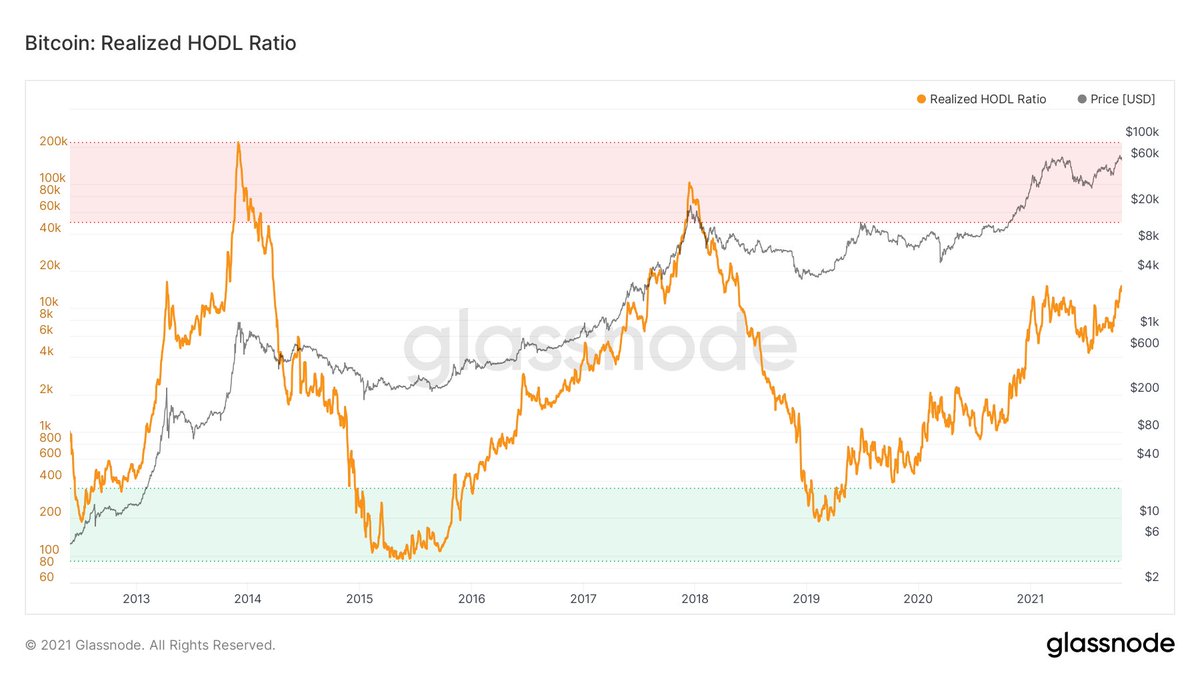
Next up we have Realized HODL Ratio (credit:
@PositiveCrypto, comparing the 1 week and 1-2 year bands of the realized HODL waves. When a large portion of supply is taken up by newer market participants, it's time to be cautious.
Warming up.
Next, we have NUPL (Unrealized profit-loss). The ideology behind this is that as price goes higher, people get greedy & don't take profits. This creates downside risk.
Note we never reached "Euphoria" earlier this year and bounced off "Optimism-Anxiety", similar to 2013.
We can also look at the Puell Multiple, created by
@kenoshaking. This divides the daily BTC issuance (in USD terms) by the 365DMA of daily issuance value.
After bouncing off the green accumulation zone during the miner capitulation over summer, we are climbing back up.
A few weeks back I published a thread on destruction so not gonna cover it in depth here. But refer to it if confused at all in the coming two posts. (Also Glassnode academy)
https://t.co/AeI7sXuhMs
First we can look at eCDD-90 (created by
@n3ocortex), which is simply the rolling 90-day sum of coin days destroyed. Applying a 90-day MA, you can see just how low destruction currently is on a relative basis. Means old coins aren't being spent. (also reflected by LTH supply)
And another way to utilize dormancy is Dormancy Flow, created by
@kenoshaking. This is a ratio of market cap and annualized dormancy (measured in USD)
Picking up a bit after bouncing off the green zone.
This is market cap/thermocap ratio. (created by
@nic__carter) This metric can be used to assess if Bitcoin's price is currently trading at a premium to the total security spend of miners.
Lukewarm.
Here we have price temperature, created by
@dilutionproof. This metric measures the number of standard deviations that price has moved away from the 4-yr moving average of Bitcoin's price.
Sitting right around fair valuation by this metric's standards.
Ok, we've talked about some behavioral measures of "overheatedness". We're now gonna look at a few price-specific models.
Note: there are countless technical indicators including RSI, MACD, MAs, etc. These will not be explained in this thread.
This is the "Top Cap" model, created by
@woonomic. This looks at the all-time moving average cap of Bitcoin and multiplies it by 35.
Currently sits just over $204,000.
Looking at Willy's top model in combination with Delta cap, we get a full suite of price levels, combined into what I've called "Top/Bottom models" (creative I know).
We are currently consolidating below the yellow line, the mean of realized price/(mean of top/delta caps).
Last price model. This is what I've called the Delta Valuation Model. This looks at Delta cap (created by
@kenoshaking) as the floor and takes a 7.5X multiple of this for the top.
Top currently sits just above $114,000.
Watch the derivs market as well. Prolonged contango and prolonged high funding rates will give a precursor for caution, but not perfect top signals.
Also, keep an eye on the % of crypto margined futures. The higher this goes, the more convexity we're set up for to the downside.
Ok, that's all I've got for now. Hopefully you found this useful. A like/retweet would be appreciated but not necessary.
FYI: Due to my account size now, when I think we're nearing a top, I'll likely speak a bit more cryptic. Look out for these things. WAGMI!
Cheers! /FIN