𝗧𝗥𝗔𝗗𝗜𝗡𝗚 𝗖𝗔𝗡𝗗𝗟𝗘𝗦𝗧𝗜𝗖𝗞 𝗣𝗔𝗧𝗧𝗘𝗥𝗡𝗦 !📊
~𝙰 𝚃𝚑𝚛𝚎𝚊𝚍~🧵
𝙿𝚕𝚎𝚊𝚜𝚎 𝚁𝚎-𝚃𝚠𝚎𝚎𝚝 𝚝𝚑𝚒𝚜 𝚝𝚠𝚎𝚎𝚝 𝚏𝚘𝚛 𝚖𝚘𝚛𝚎 𝚛𝚎𝚊𝚌𝚑 🤞
@ProdigalTrader @SouravSenguptaI @PAlearner @Puretechnicals9 @caniravkaria @MrigankPuri @nison_steve @chartmojo
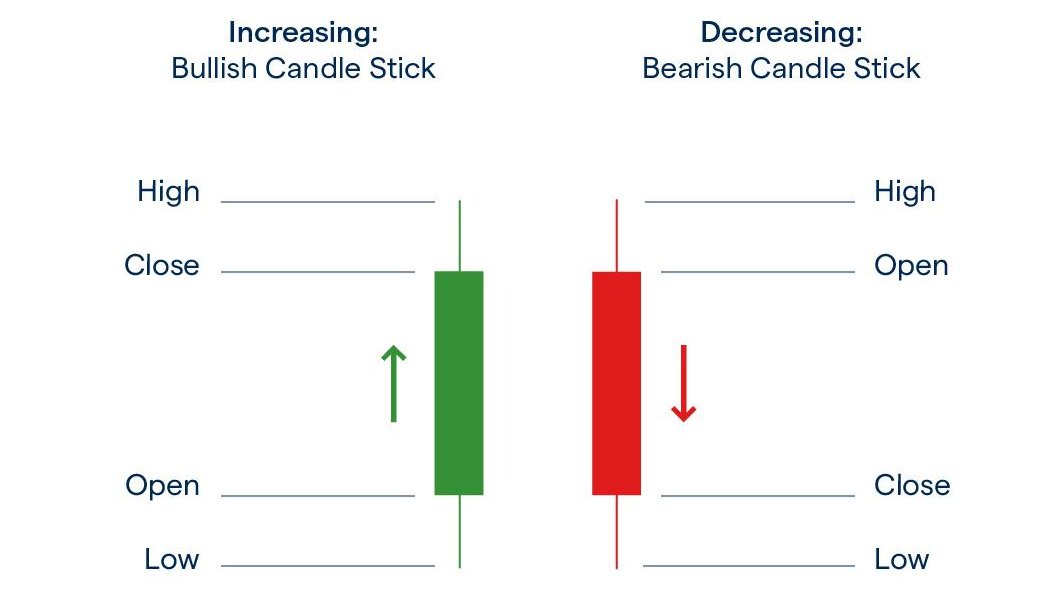
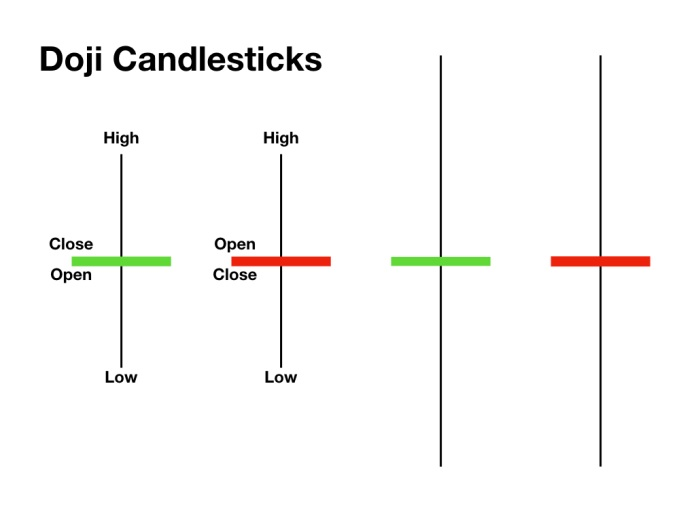
𝗢𝗽𝗲𝗻: The opening price.
𝗛𝗶𝗴𝗵: The highest price over a specific time period.
𝗟𝗼𝘄: The lowest price over a specific time period.
𝗖𝗹𝗼𝘀𝗲: The closing price.
Here’s an example:
𝐂𝐀𝐍𝐃𝐋𝐄𝐒𝐓𝐈𝐂𝐊 𝐂𝐇𝐄𝐀𝐓𝐒𝐇𝐄𝐄𝐓:
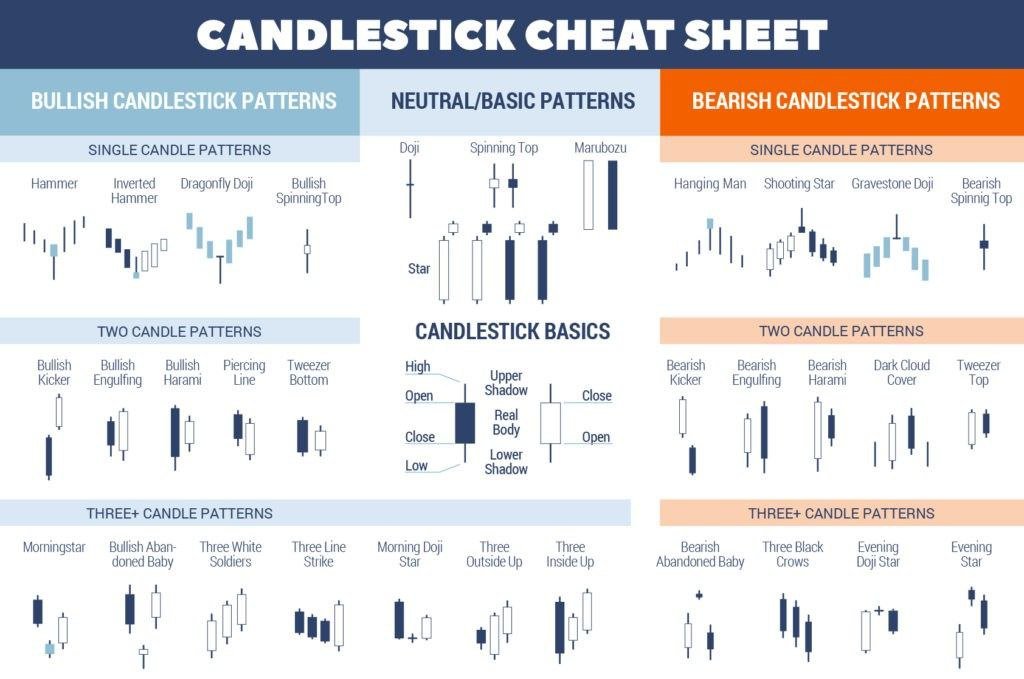
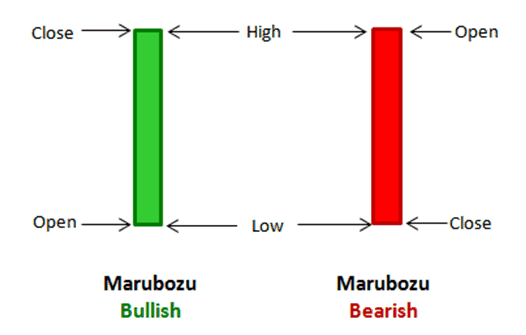
A Marubuzo indicates that there is so much buying/selling interest in a stock that the market participants were willing to buy/sell the stock at every price point during the day, so much so that the stock closed near its high/low point for the day.
This means the open and close prices are equal. Doji’s provide crucial information about the market sentiments and is an important candlestick pattern.
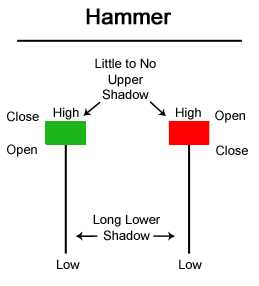
The bullish hammer is a significant candlestick pattern that occurs at the bottom of the trend. A hammer consists of small real body at the upper end of the trading range with a long lower shadow. The longer the lower shadow the more bullish it is.
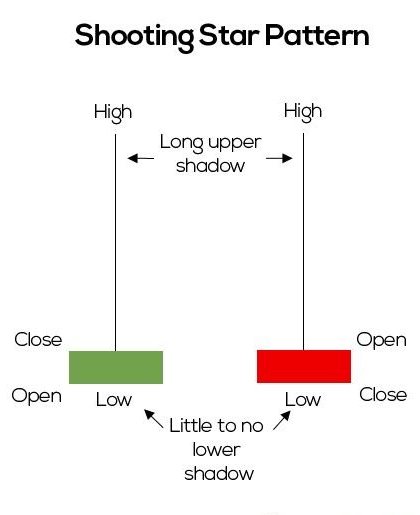
The shooting star is a top reversal pattern. A shooting star signals a market high. Since the shooting star is seen after a high, the pattern signals selling pressure.
𝗤𝘂𝗲𝘀𝘁𝗶𝗼𝗻 𝟭: 𝗪𝗵𝗲𝗿𝗲 𝗱𝗶𝗱 𝘁𝗵𝗲 𝗽𝗿𝗶𝗰𝗲 𝗰𝗹𝗼𝘀𝗲 𝗿𝗲𝗹𝗮𝘁𝗶𝘃𝗲 𝘁𝗼 𝘁𝗵𝗲 𝗿𝗮𝗻𝗴𝗲?
Well, if the price closed the near highs of the range, that tells you the buyers are in control. But, if the price closed near the lows of the range and shows rejection of higher prices, it shows that sellers are in control.
This question will help you determine if there’s any
strength (or conviction) behind the move.
And, please point out if there is any mistake on my end. Would love to hear each and everyone's views.
If you liked reading this then please Re-Tweet the first tweet in this thread and follow @sarosij_ghosh for more stuff on trading & investing. 😇🙏
More from All

MASTER THREAD on Short Strangles.
Curated the best tweets from the best traders who are exceptional at managing strangles.
• Positional Strangles
• Intraday Strangles
• Position Sizing
• How to do Adjustments
• Plenty of Examples
• When to avoid
• Exit Criteria
How to sell Strangles in weekly expiry as explained by boss himself. @Mitesh_Engr
• When to sell
• How to do Adjustments
• Exit
Beautiful explanation on positional option selling by @Mitesh_Engr
Sir on how to sell low premium strangles yourself without paying anyone. This is a free mini course in
1st Live example of managing a strangle by Mitesh Sir. @Mitesh_Engr
• Sold Strangles 20% cap used
• Added 20% cap more when in profit
• Booked profitable leg and rolled up
• Kept rolling up profitable leg
• Booked loss in calls
• Sold only
2nd example by @Mitesh_Engr Sir on converting a directional trade into strangles. Option Sellers can use this for consistent profit.
• Identified a reversal and sold puts
• Puts decayed a lot
• When achieved 2% profit through puts then sold
Curated the best tweets from the best traders who are exceptional at managing strangles.
• Positional Strangles
• Intraday Strangles
• Position Sizing
• How to do Adjustments
• Plenty of Examples
• When to avoid
• Exit Criteria
How to sell Strangles in weekly expiry as explained by boss himself. @Mitesh_Engr
• When to sell
• How to do Adjustments
• Exit
1. Let's start option selling learning.
— Mitesh Patel (@Mitesh_Engr) February 10, 2019
Strangle selling. ( I am doing mostly in weekly Bank Nifty)
When to sell? When VIX is below 15
Assume spot is at 27500
Sell 27100 PE & 27900 CE
say premium for both 50-50
If bank nifty will move in narrow range u will get profit from both.
Beautiful explanation on positional option selling by @Mitesh_Engr
Sir on how to sell low premium strangles yourself without paying anyone. This is a free mini course in
Few are selling 20-25 Rs positional option selling course.
— Mitesh Patel (@Mitesh_Engr) November 3, 2019
Nothing big deal in that.
For selling weekly option just identify last week low and high.
Now from that low and high keep 1-1.5% distance from strike.
And sell option on both side.
1/n
1st Live example of managing a strangle by Mitesh Sir. @Mitesh_Engr
• Sold Strangles 20% cap used
• Added 20% cap more when in profit
• Booked profitable leg and rolled up
• Kept rolling up profitable leg
• Booked loss in calls
• Sold only
Sold 29200 put and 30500 call
— Mitesh Patel (@Mitesh_Engr) April 12, 2019
Used 20% capital@44 each
2nd example by @Mitesh_Engr Sir on converting a directional trade into strangles. Option Sellers can use this for consistent profit.
• Identified a reversal and sold puts
• Puts decayed a lot
• When achieved 2% profit through puts then sold
Already giving more than 2% return in a week. Now I will prefer to sell 32500 call at 74 to make it strangle in equal ratio.
— Mitesh Patel (@Mitesh_Engr) February 7, 2020
To all. This is free learning for you. How to play option to make consistent return.
Stay tuned and learn it here free of cost. https://t.co/7J7LC86oW0