Authors The_Chartist 📈

A bullish flag pattern right after the breakout. Although the broader rectangle target of 1190 is way more than this bullish flag target https://t.co/wdAzb7SS7L
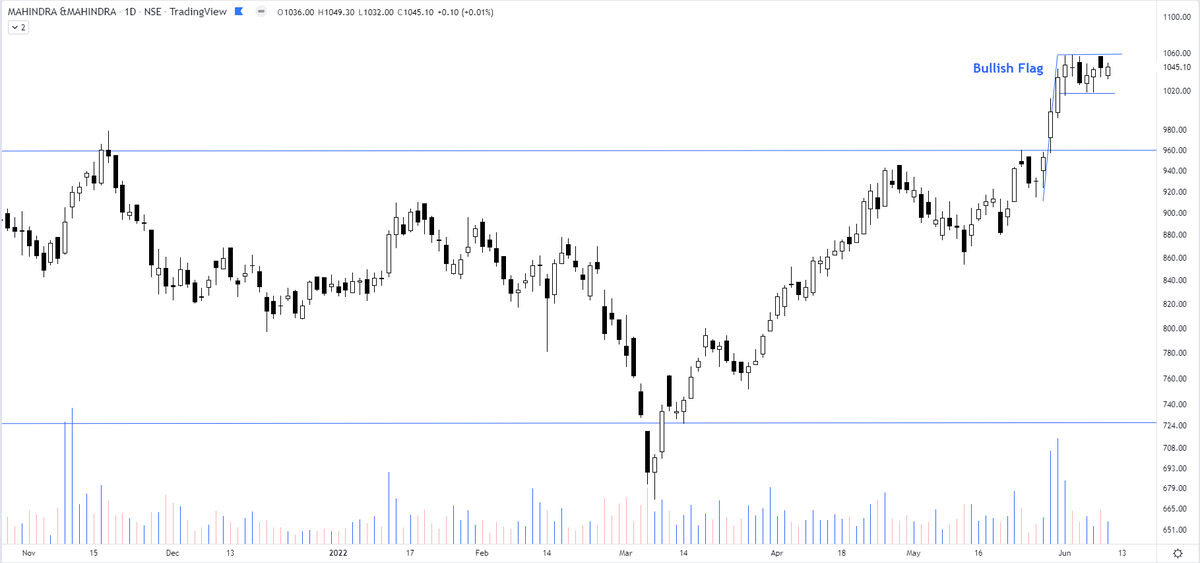
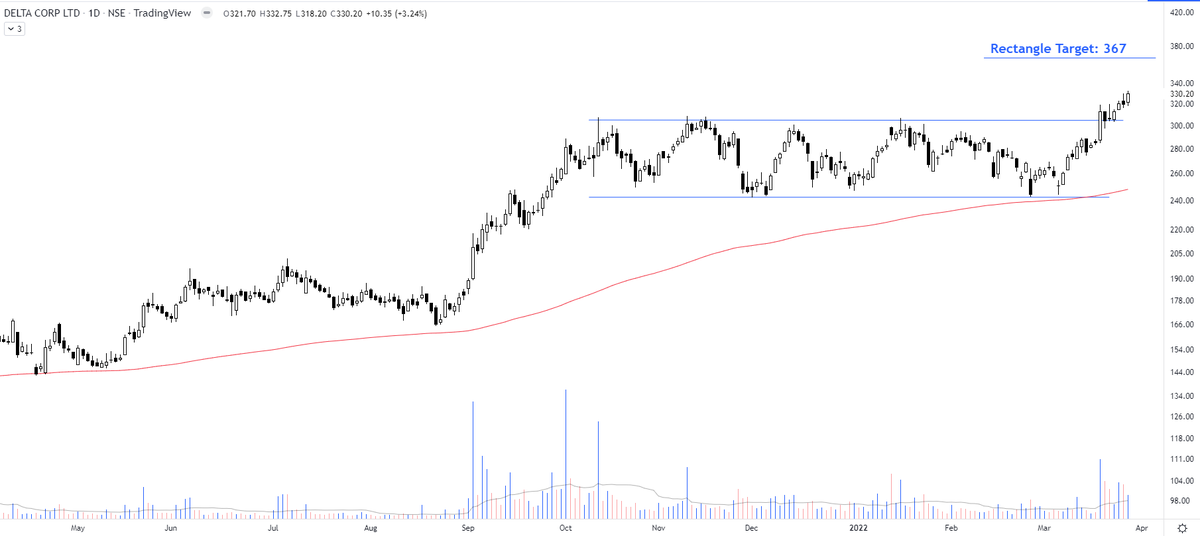
Interesting chart of Mahindra & Mahindra consolidating in a rectangle pattern & the price not falling back to the lower support. pic.twitter.com/GJ7rCfkB9f
— The_Chartist \U0001f4c8 (@charts_zone) May 26, 2022
This exercise will tell you about your inherent strengths & weaknesses. 👇👇
How to record a trading journal (TJ) & what to analyze?
— The_Chartist \U0001f4c8 (@charts_zone) December 14, 2021
What is in a TJ?
Buy Date
Stock Name
The time frame you analyzed (D/W/M)
Long/Short?
Buy Price
SL
Sell Price
Risk took (% of capital)
Sell date
No. of days held
P/L
P/L as % of capital
Buy Reason?
Invested capital/trade pic.twitter.com/WnrvmYuOV0

Jubilant Foodworks - updated chart https://t.co/mH1TTqHbcq
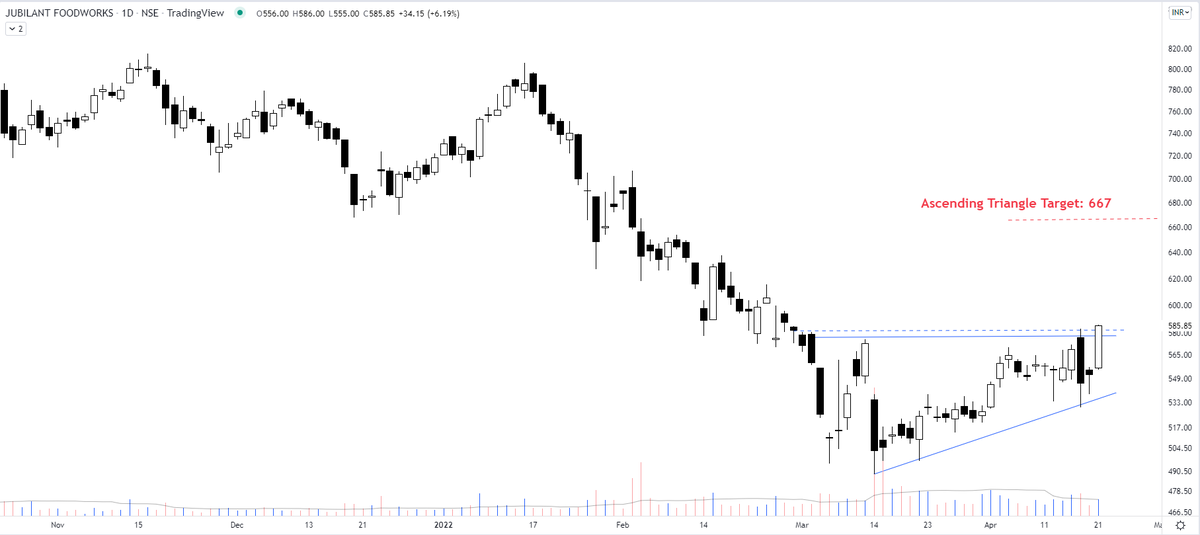
Post the capitulation move, I am anticipating an ascending triangle breakout in Jubilant Foodworks however the buy is not triggered yet. That target open would be 667.
— The_Chartist \U0001f4c8 (@charts_zone) April 21, 2022
Ascending triangles also act as key reversal patterns. https://t.co/M1vLYEsngf pic.twitter.com/f06rbJhLaq
GOLD https://t.co/l6pEGDpAkL
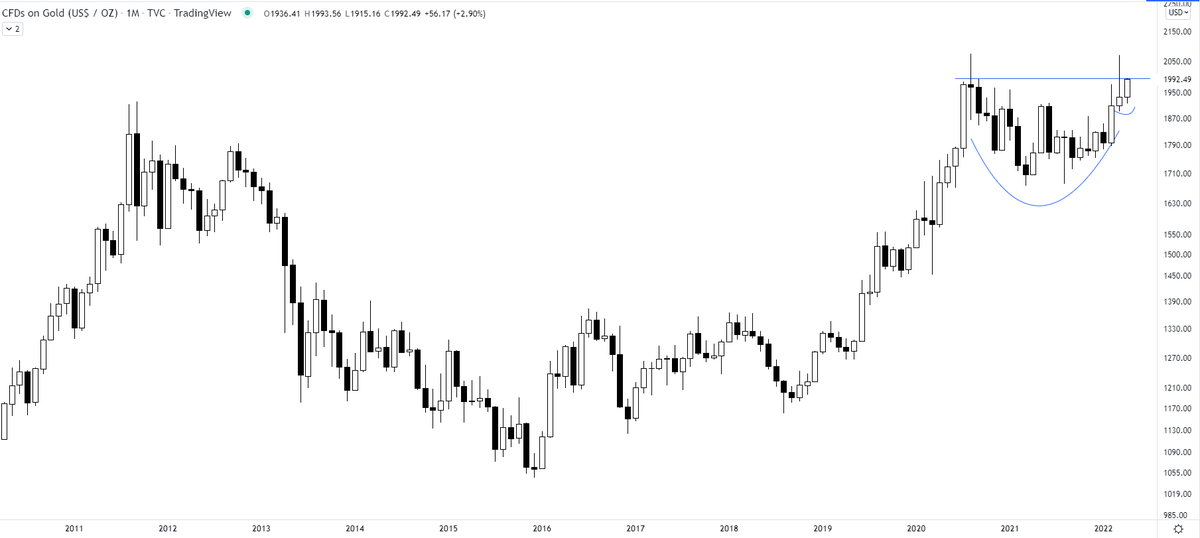
Most interesting chart:
— The_Chartist \U0001f4c8 (@charts_zone) February 12, 2022
Orange line = Gold
Blue Curve = Gold/S&P 500
Previously the ratio crossed 50 days MA in Feb' 20 with Gold giving a breakout on the charts. The previous cross of 50 days MA didn't result in gold breaking out. pic.twitter.com/HRG1fvsILp
Tata Elxsi https://t.co/HGCzOz1ALI
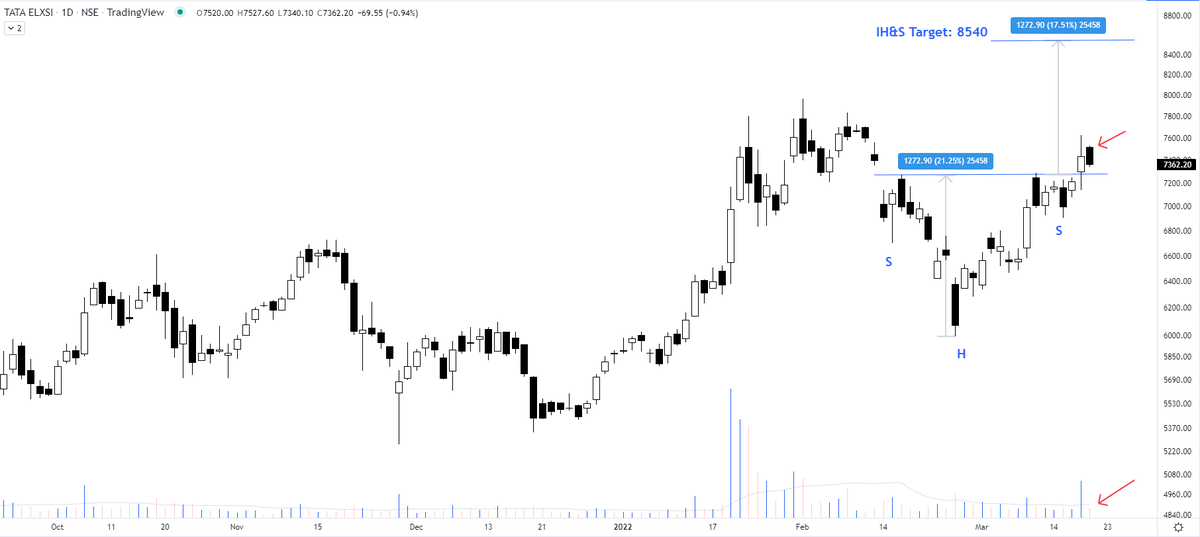
Correction \U0001f447
— The_Chartist \U0001f4c8 (@charts_zone) March 20, 2022
During upward breakouts, I have to consider price targets and not %age targets. Therefore the target comes out to be 8540 and not 8900 as mentioned before.
The chart stands updated.
Tata Elxsi https://t.co/sdP9X1s9qs pic.twitter.com/Gmhn3OYiNA
Some went into the watchlist and some were actionable where my few long positions are already open.
— The_Chartist \U0001f4c8 (@charts_zone) December 25, 2021
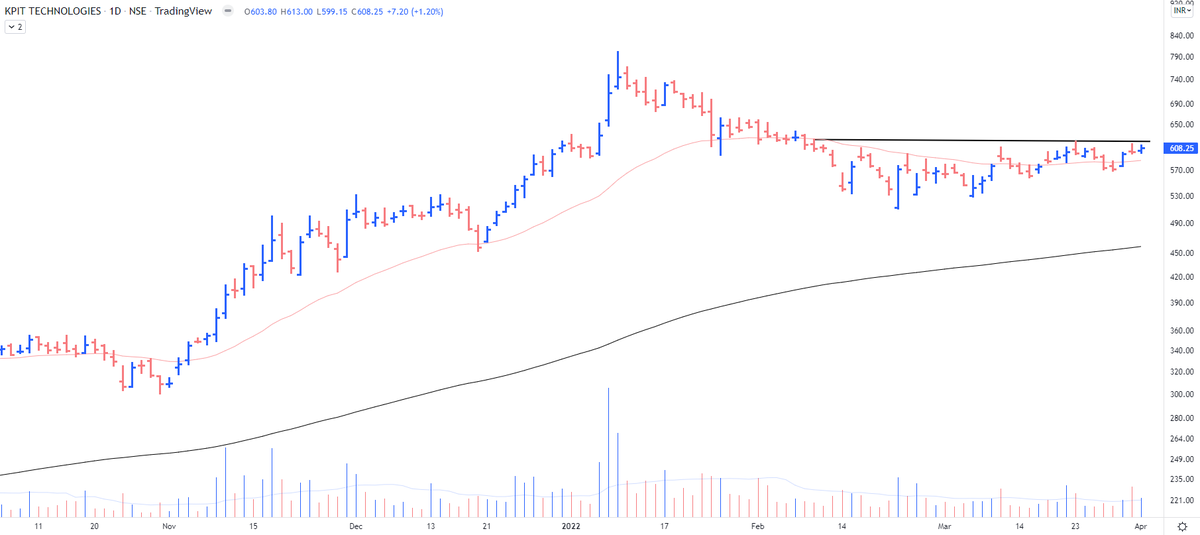
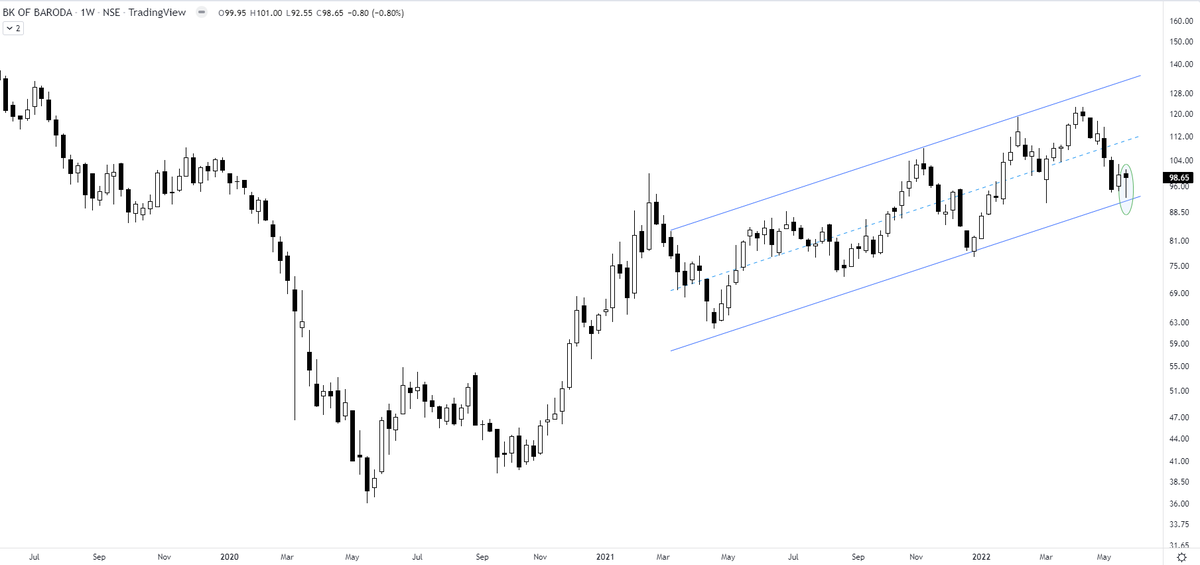
What am I looking at in the charts? Flat base formation breakouts/Pullbacks/Trendline support. Keep it simple. Ex attached.
29/95 for further funda scans. P<100 (I don't trade) https://t.co/y4PKUBrA44 pic.twitter.com/e9cvcrKsnu
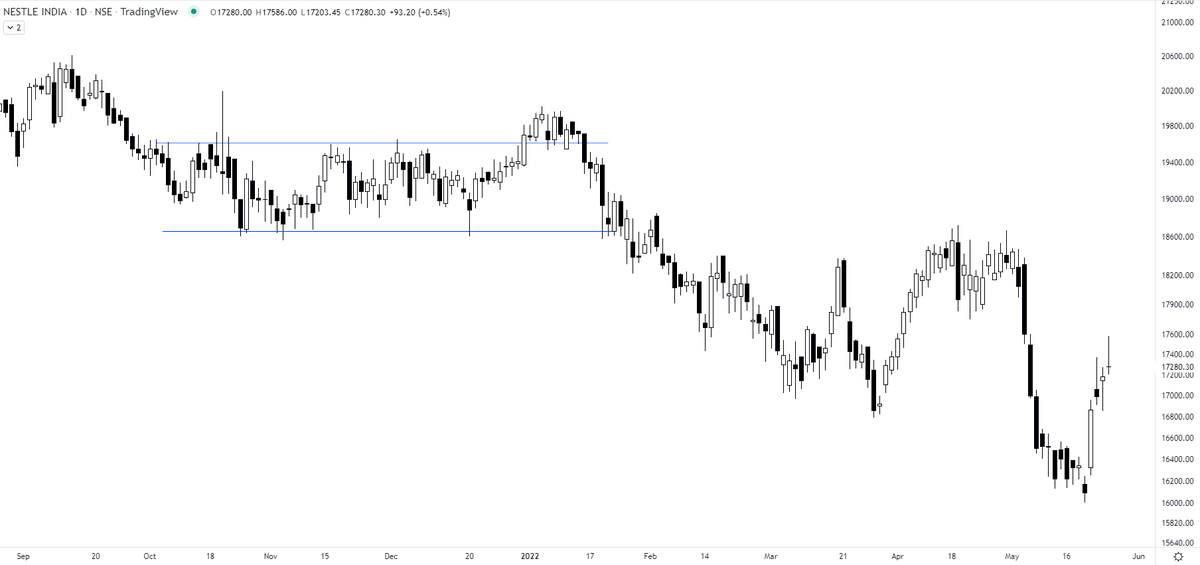
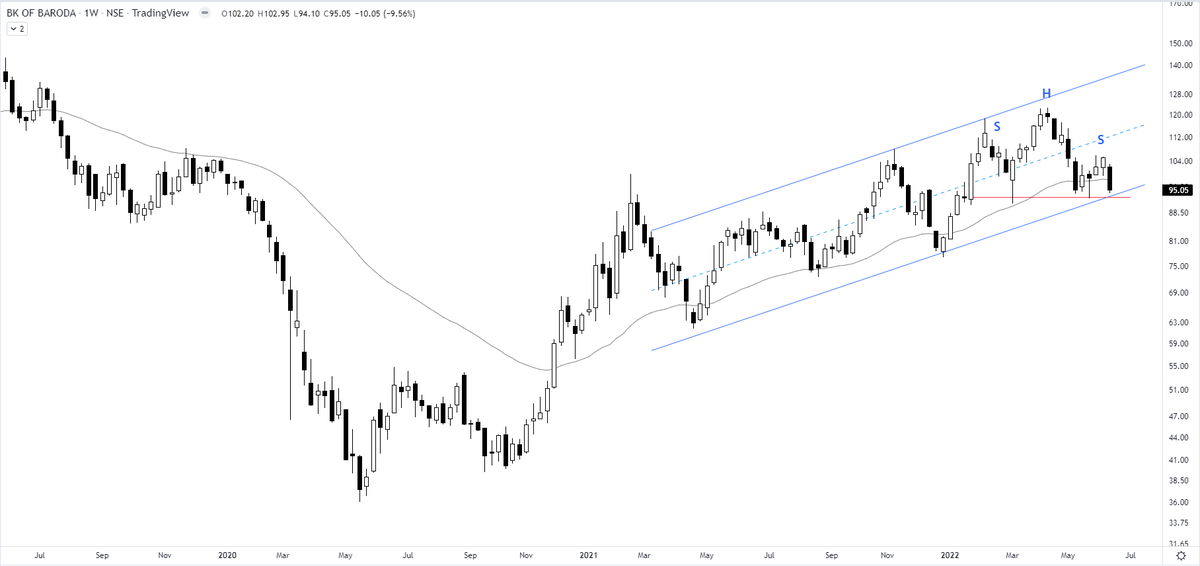
Nifty Private Bank https://t.co/BwG1DKhhLc
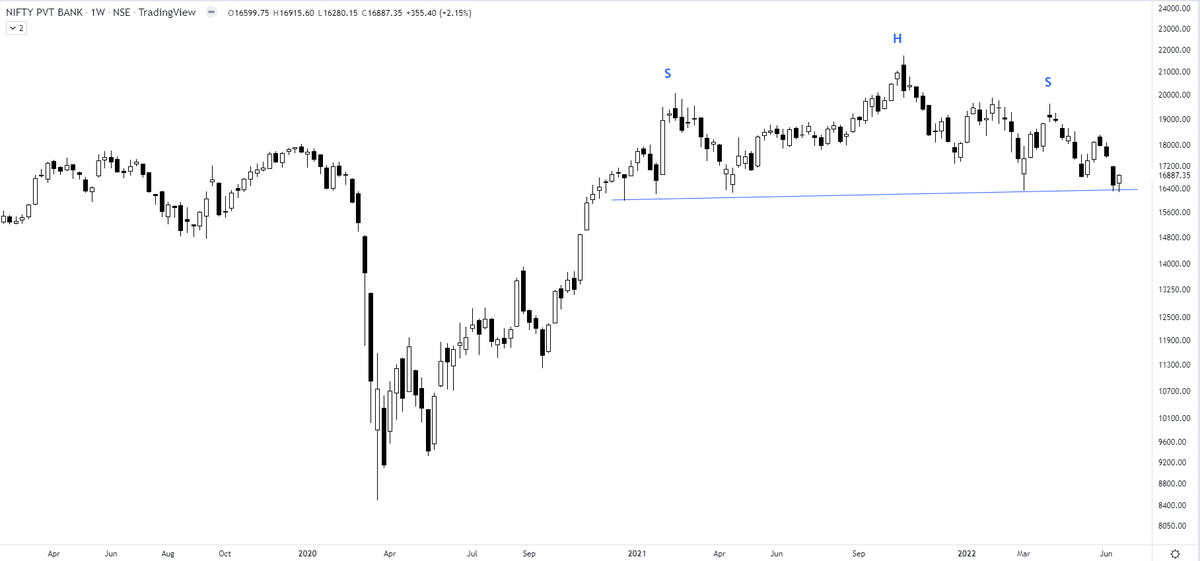
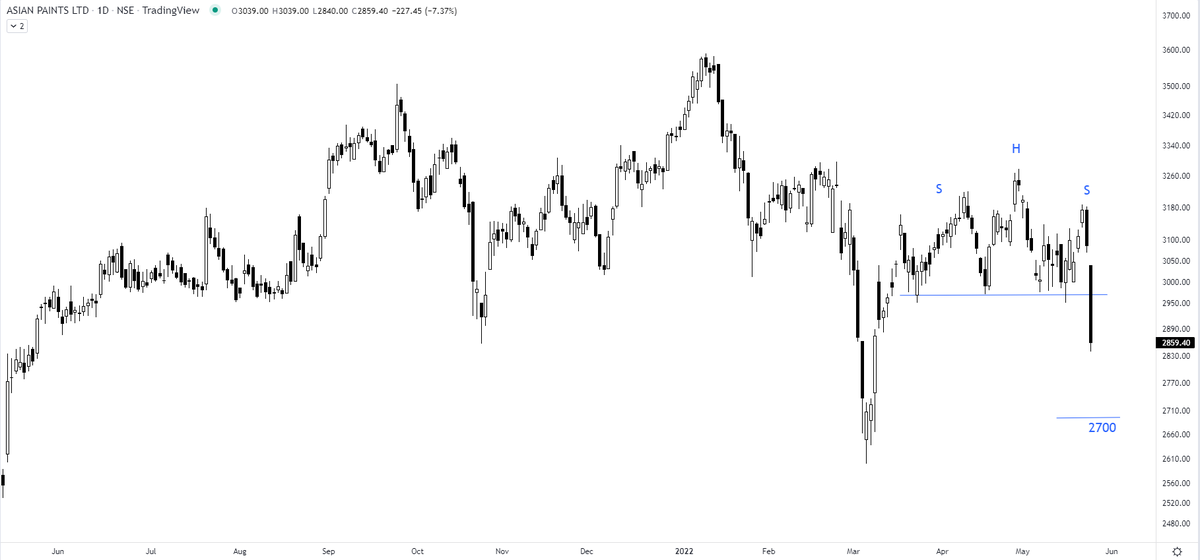
I am watching a big bearish H&S top building up in Nifty Private Bank Index. Any breakdown will result in increased volatility in respective charts. For traders - definitely not a spot to be in. The index has to move beyond 19900 to negate the pattern. pic.twitter.com/IGFeyNrtQV
— The_Chartist \U0001f4c8 (@charts_zone) June 19, 2022

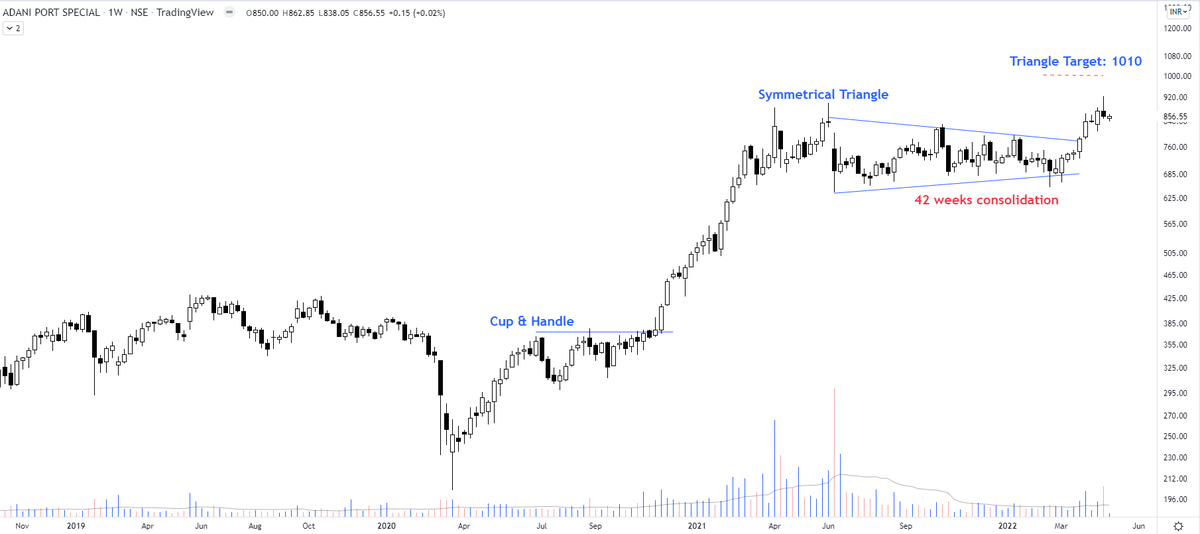
Adani Ports - the 42 weeks of price consolidation in a symmetrical triangle has decisively broken out for the open target of 1010 https://t.co/vGyAGlwKCw pic.twitter.com/2tVmwddeOX
— The_Chartist \U0001f4c8 (@charts_zone) April 5, 2022