Authors The_Chartist 📈

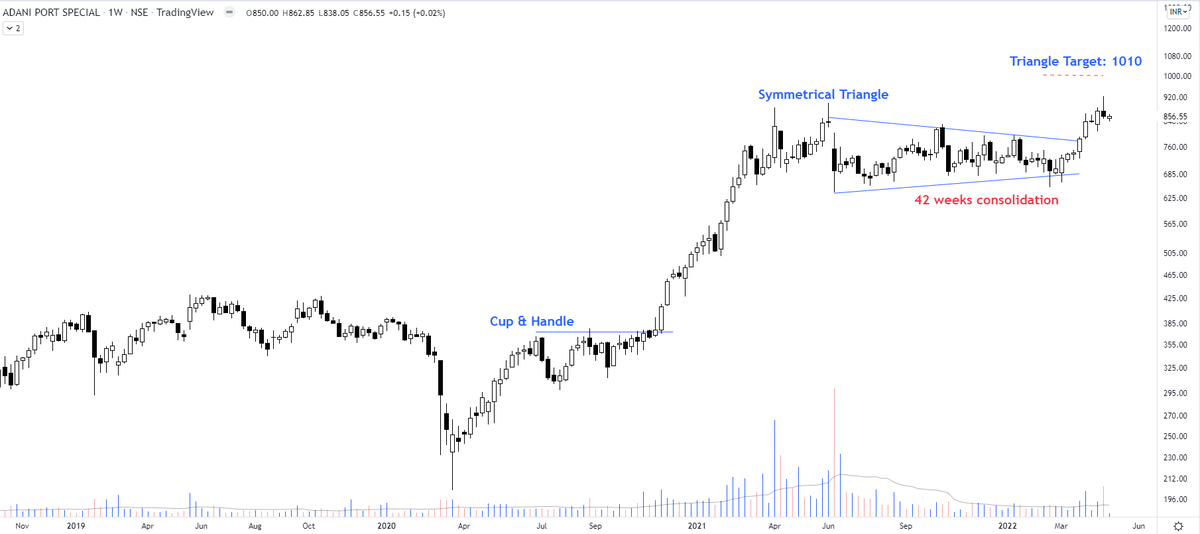
Adani Ports - the 42 weeks of price consolidation in a symmetrical triangle has decisively broken out for the open target of 1010 https://t.co/vGyAGlwKCw pic.twitter.com/2tVmwddeOX
— The_Chartist \U0001f4c8 (@charts_zone) April 5, 2022


Jubilant Foodworks https://t.co/ZBMsHWfg7R
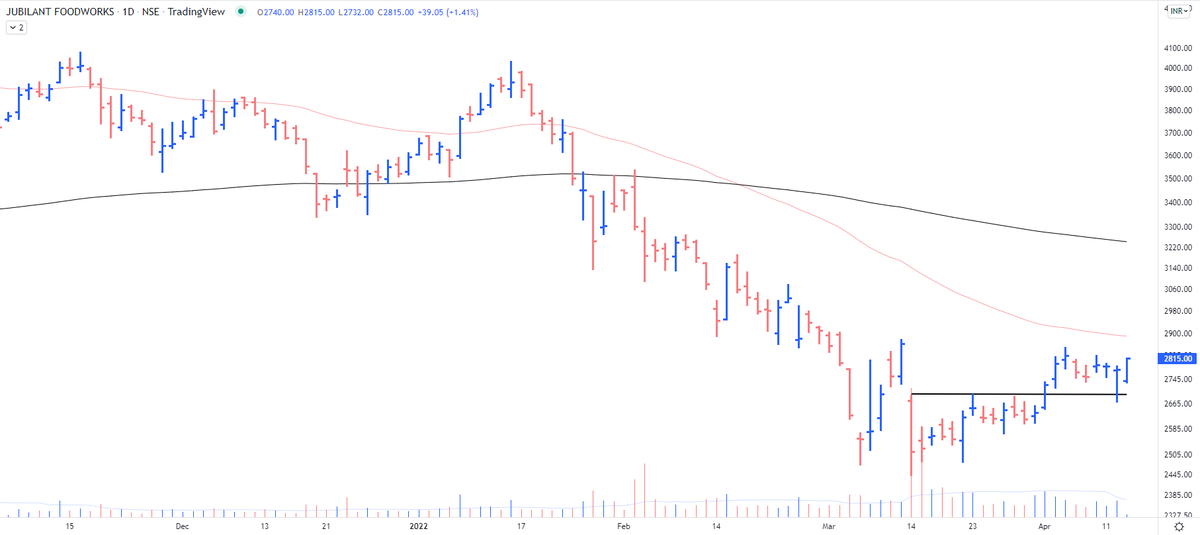
The selling volumes with indecisive candles tell a lot about the selling pressure. I don't think there are more sellers left in here. It is one of the biggest trades for me and my views may be biased but SL is at a cost now so I lose nothing unless it gaps down.
— The_Chartist \U0001f4c8 (@charts_zone) April 7, 2022
Jubilant Food https://t.co/M1vLYEsngf pic.twitter.com/5GOCWtgScD

PS - conservative traders always wait for the BO https://t.co/o79tNRd9Fo
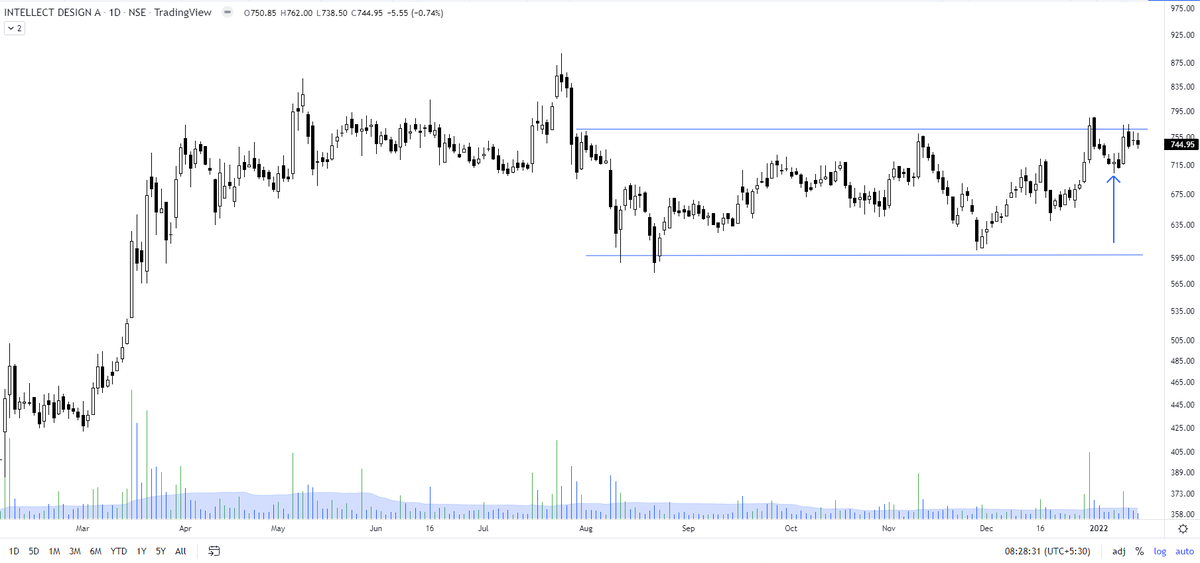
ICICI Bank #NSE - Can you anticipate a breakout? If you look at point 1,2&3 on the chart in rectangle formation, you will notice the buyer is willing to pay a higher price. The demand zone is shifting upwards which signifies the weakness of sellers & a potential BO to the upside. pic.twitter.com/urGbGz643N
— The_Chartist \U0001f4c8 (@charts_zone) July 23, 2021

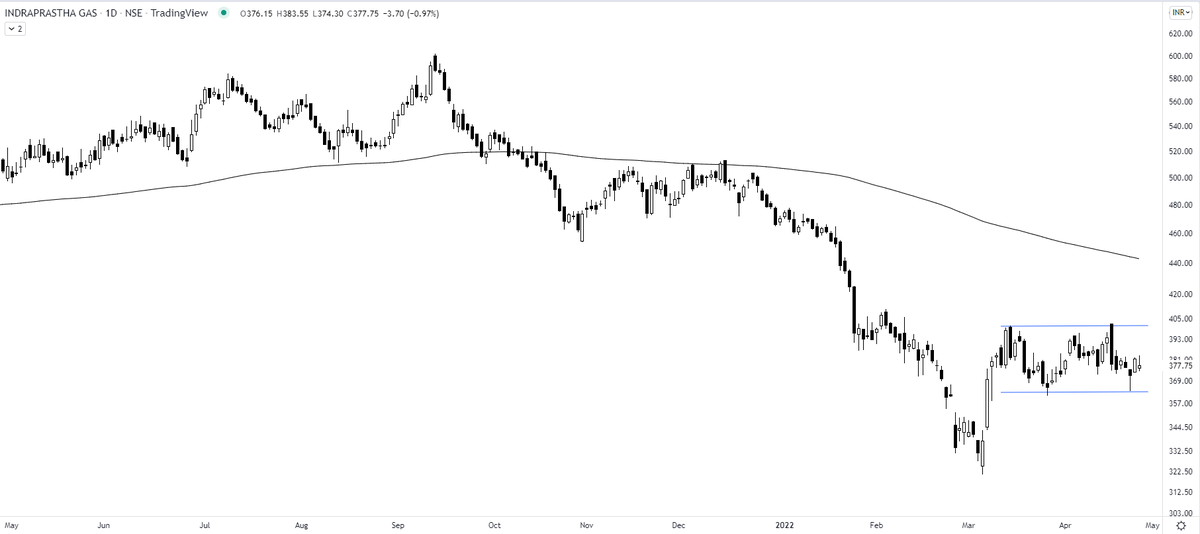
I posted this chart of IGL last month & waited for the trigger. It never got activated & fast forward it to today, the stock is almost down 25% from the previously shared levels. https://t.co/LYzRsOwyO4 pic.twitter.com/ChDx79HQAx
— The_Chartist \U0001f4c8 (@charts_zone) January 31, 2022
NIIT - a new high https://t.co/o9Sv2yT5m5
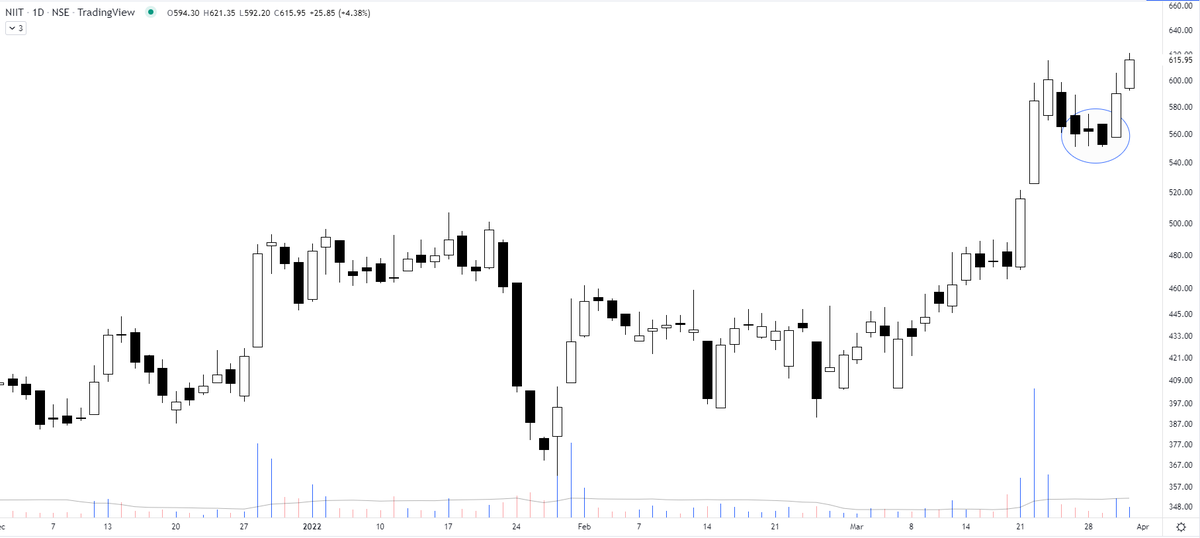
One application of Fibonacci is to look for the retracement level in the strongest stocks. A strong stock must not retrace below 38%.
— The_Chartist \U0001f4c8 (@charts_zone) March 28, 2022
NIIT Limited. That often helps in timing our SIP purchases/swing trades. pic.twitter.com/6lB7zNJOFI
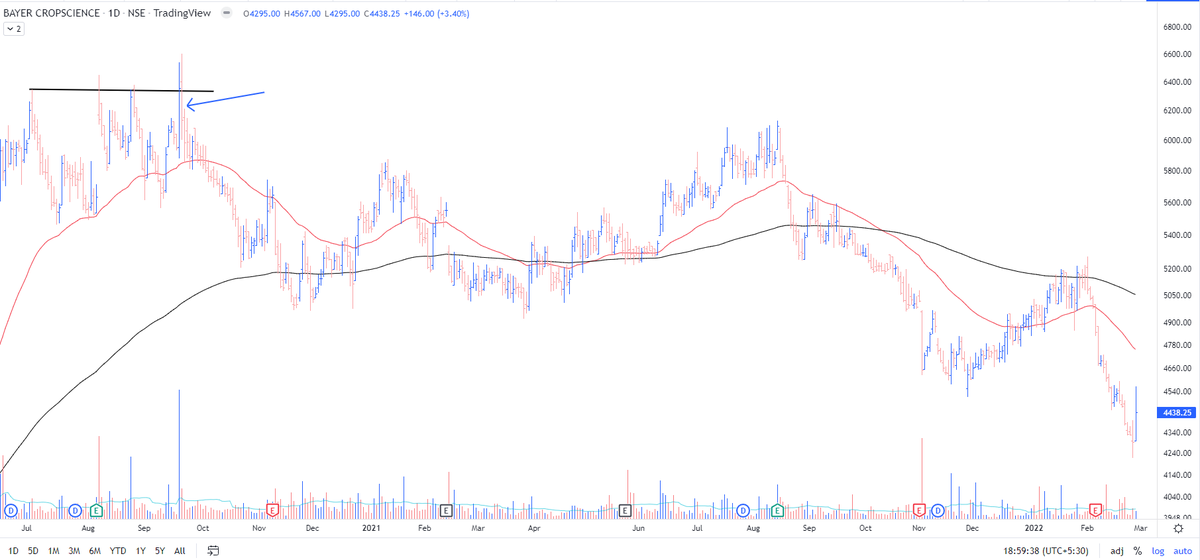

Saregama - you must analyze this chart for why it failed. A normal pullback is still OK but retracement on high volumes is not a healthy sign at all. that too with breaking below a key 50 MA. https://t.co/gKJQtbkaio pic.twitter.com/iG9FGc70ue
— The_Chartist \U0001f4c8 (@charts_zone) March 16, 2022