Authors The_Chartist 📈


USDINR - a breakout that will not bode well for the equities
78+ https://t.co/AWqZxF5B1L
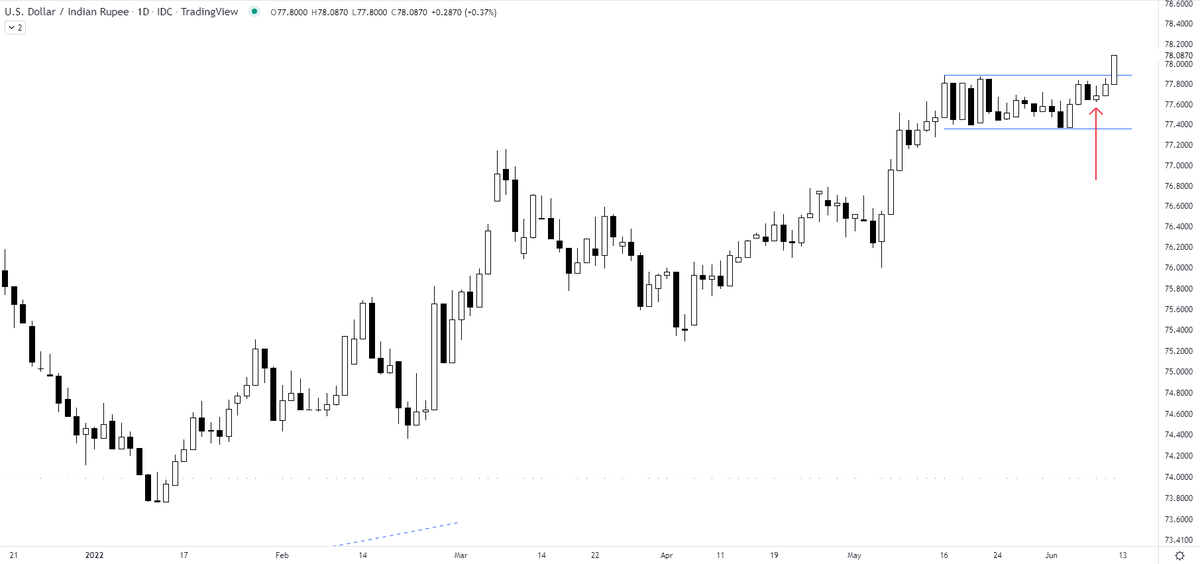
Can you anticipate a breakout? Yes
— The_Chartist \U0001f4c8 (@charts_zone) June 10, 2022
the attached tweet.
now the chart is for USDINR https://t.co/Vb2wKaCvTB pic.twitter.com/INo0GC4fGY
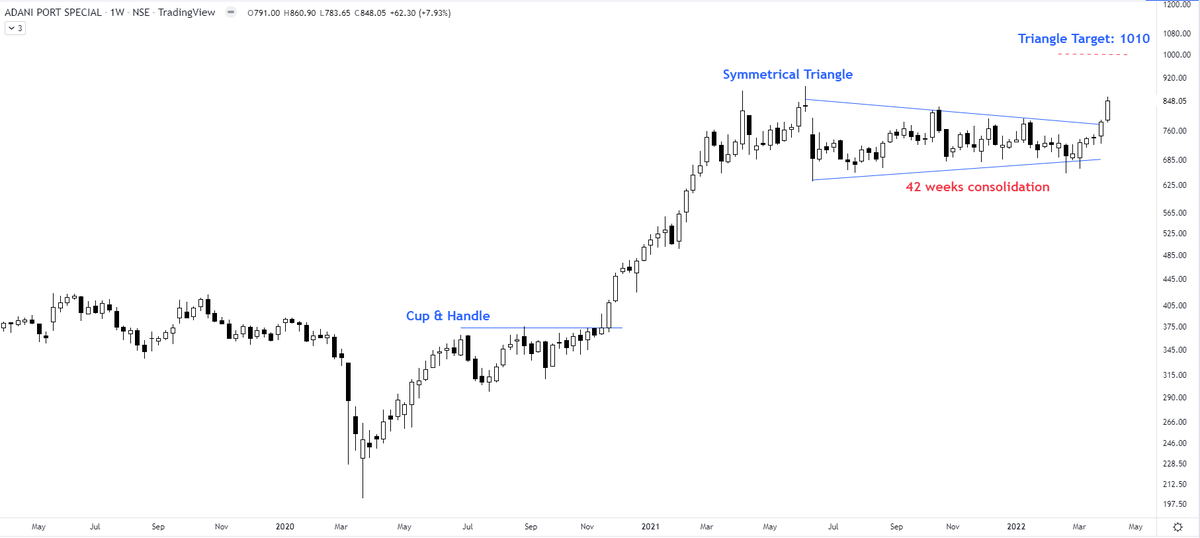
Adani Ports - updated chart. Fast forward & the stock is almost at the same level. However, the symmetrical triangle met its target exactly and became a part of a major triangle.
— The_Chartist \U0001f4c8 (@charts_zone) December 14, 2021
What makes it interesting is support is also 200 MA which adds another confluence point https://t.co/Tx52lzy9ZV pic.twitter.com/Cq67WNCHS3
Result?
1850$ to 2070$
Updated chart https://t.co/l6pEGD7r6D
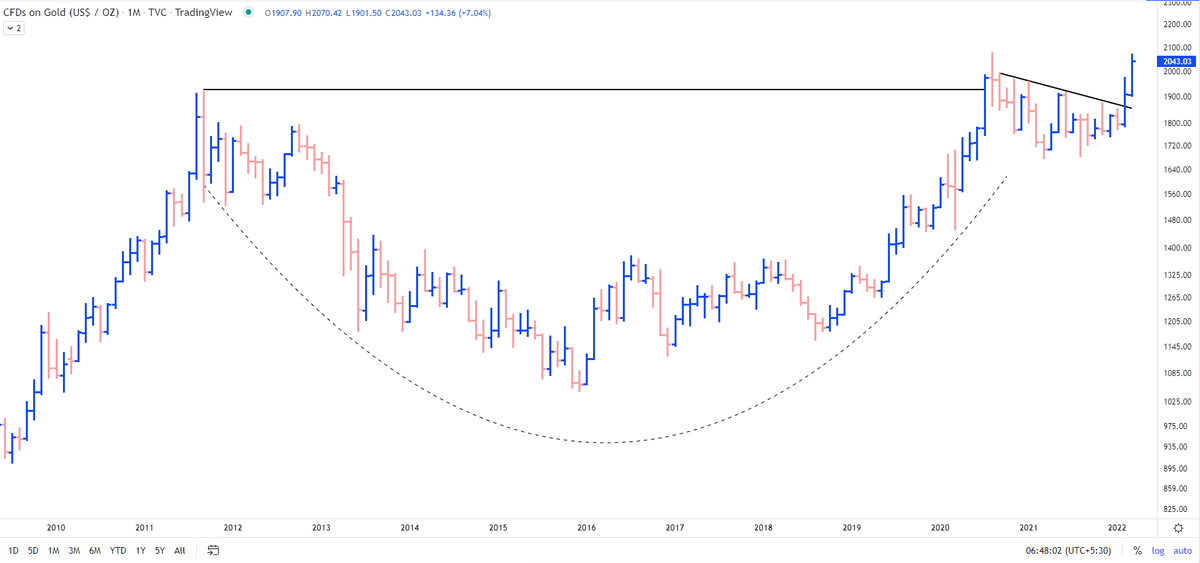
Most interesting chart:
— The_Chartist \U0001f4c8 (@charts_zone) February 12, 2022
Orange line = Gold
Blue Curve = Gold/S&P 500
Previously the ratio crossed 50 days MA in Feb' 20 with Gold giving a breakout on the charts. The previous cross of 50 days MA didn't result in gold breaking out. pic.twitter.com/HRG1fvsILp
Target opened as per the pattern is 8900 https://t.co/nRqYqPnPB3
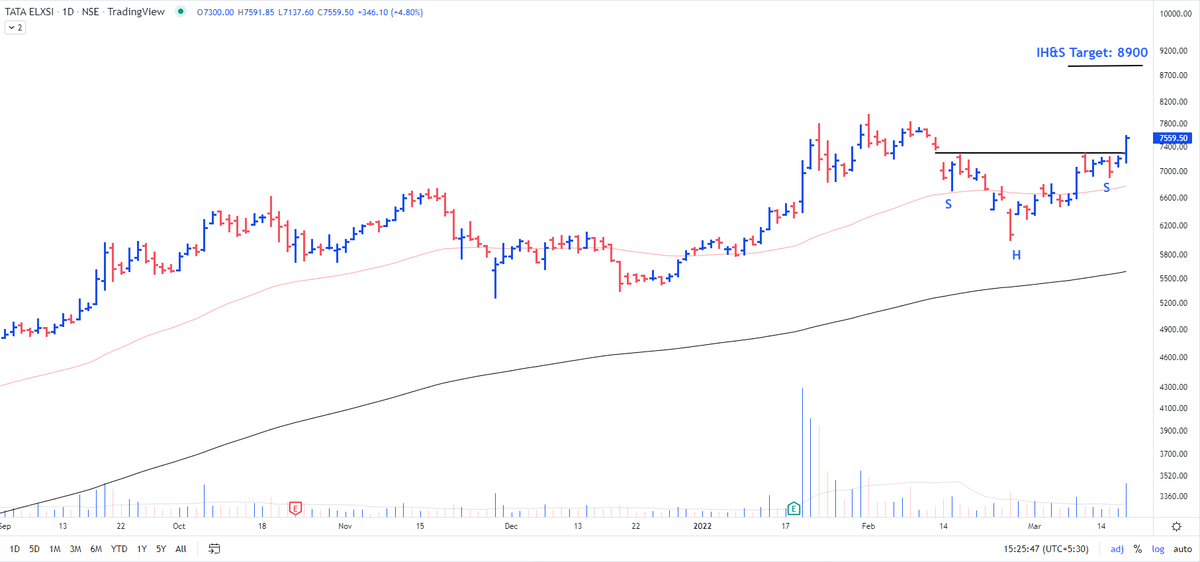
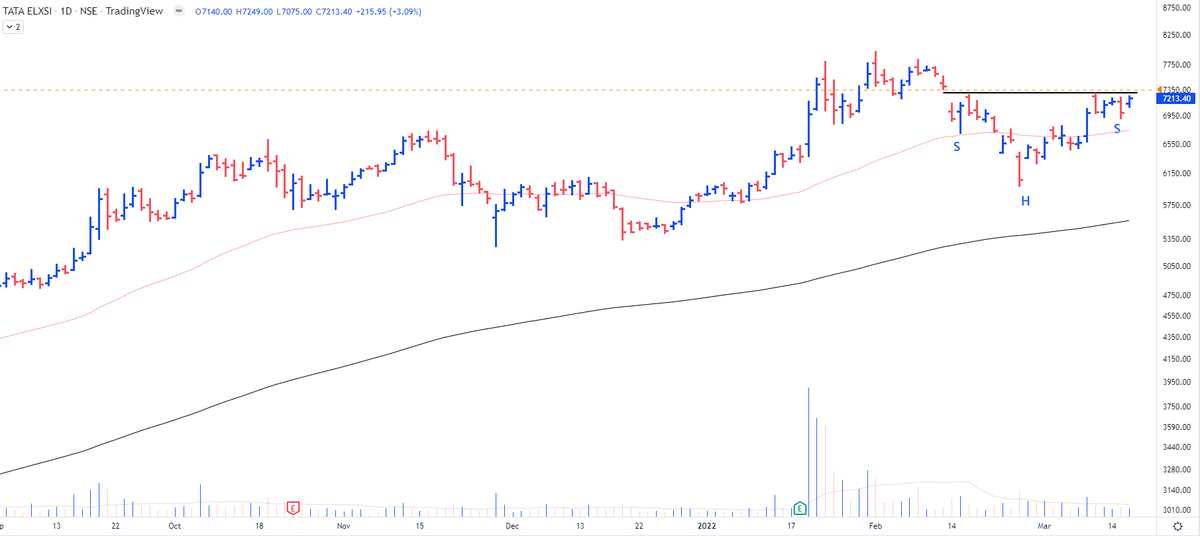
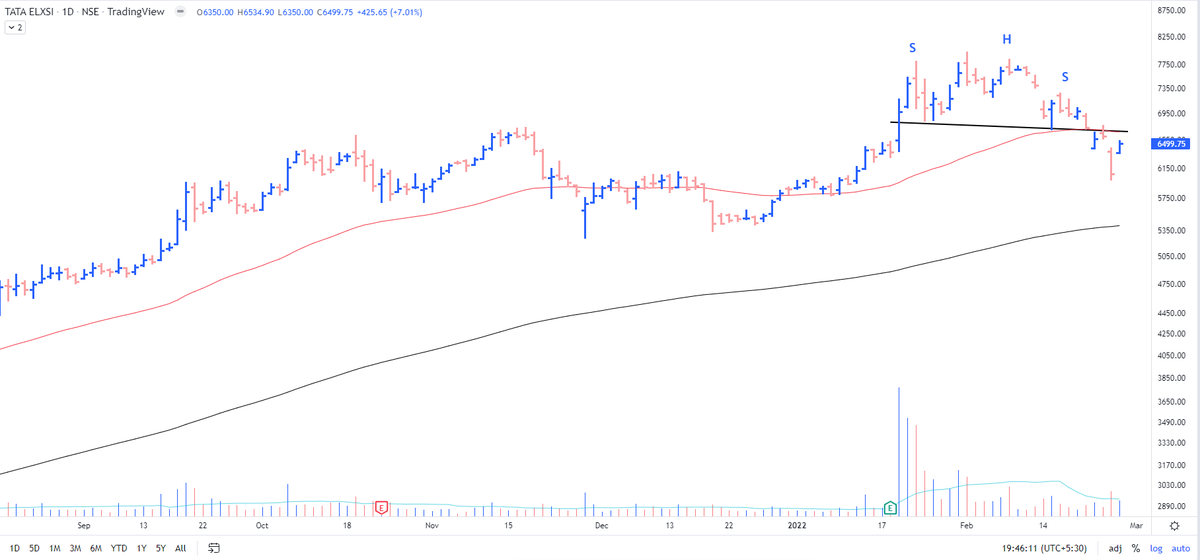
Tata Elxsi - I waited for the trigger today but to no avail. The setup is still the best with price consolidating right in the RS zone. Waiting for the breakout till then no action. pic.twitter.com/LnOPswWgAp
— The_Chartist \U0001f4c8 (@charts_zone) March 16, 2022
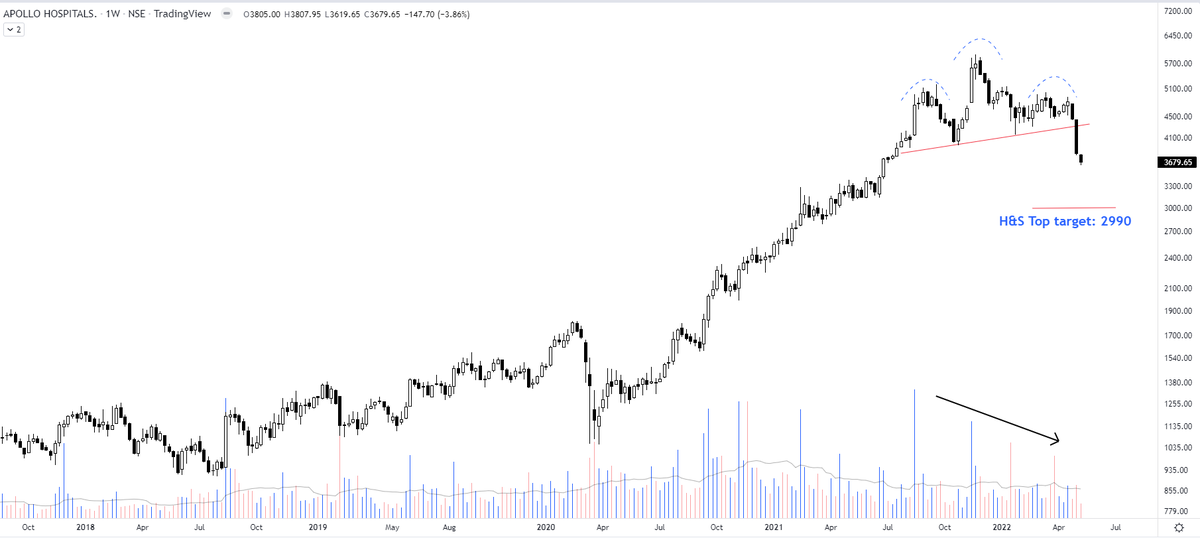
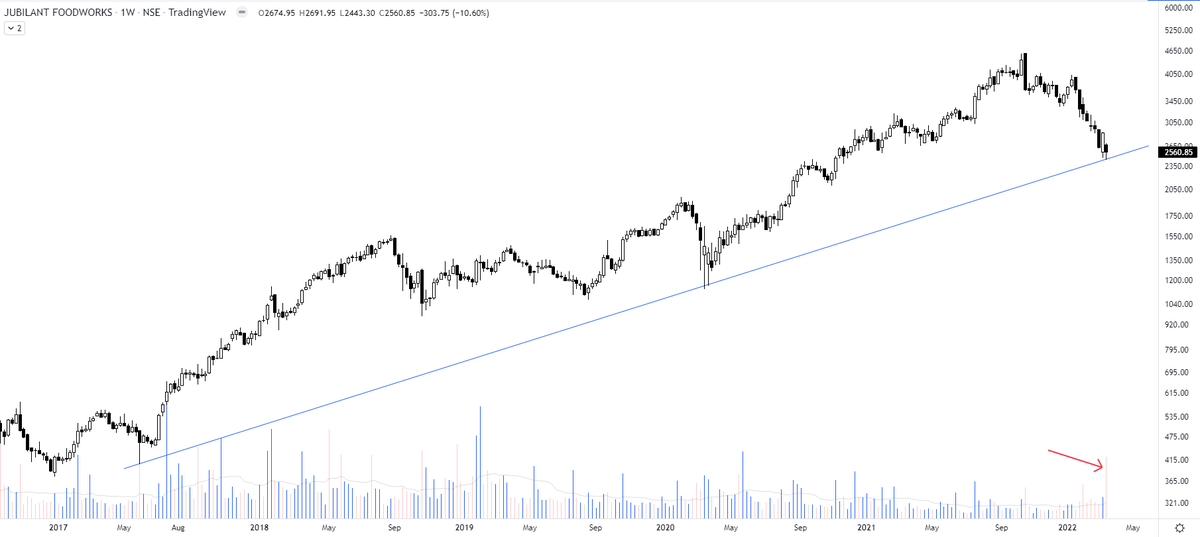
Holding this from lower levels - the reason being capitulation.
Jubilant Foodworks https://t.co/M1vLYEbkef

The selling climax is accompanied by volume bars of such magnitude that I highlighted in the chart. In almost all cases, they signify that even the last bull has thrown in the towel & there is no further selling left. Will observe in this case.
— The_Chartist \U0001f4c8 (@charts_zone) March 15, 2022
Jubilant Food pic.twitter.com/j7bGSdhkRW
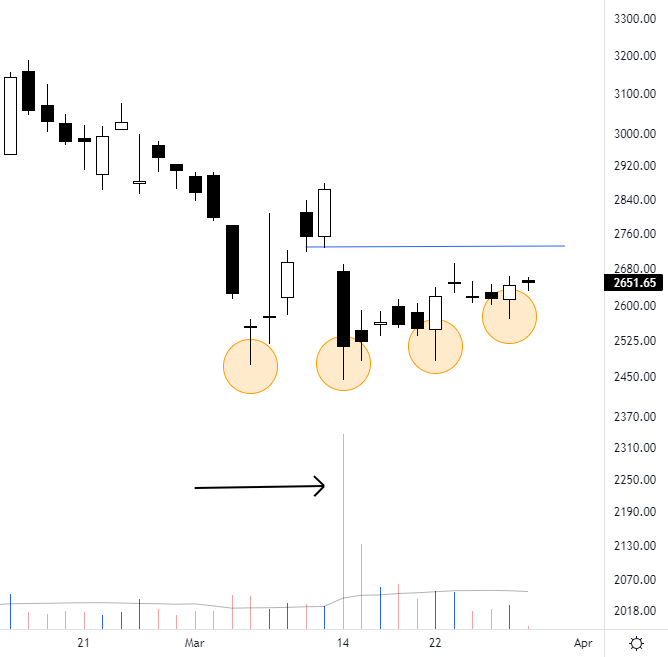
Jubilant Foodworks https://t.co/oarPRnT0Vk
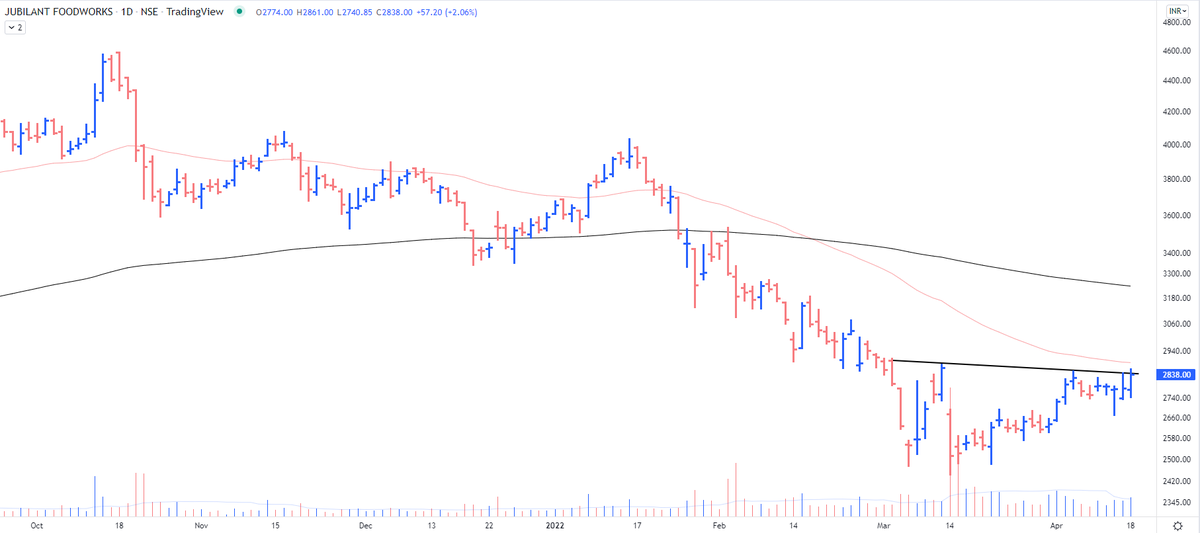
The chart signals an upcoming violent move. I may be wrong but the risk is getting too low in here. Keep an eye out.
— The_Chartist \U0001f4c8 (@charts_zone) April 18, 2022
Holding this from lower levels - the reason being capitulation.
Jubilant Foodworks https://t.co/M1vLYEbkef pic.twitter.com/TVXZKo028g
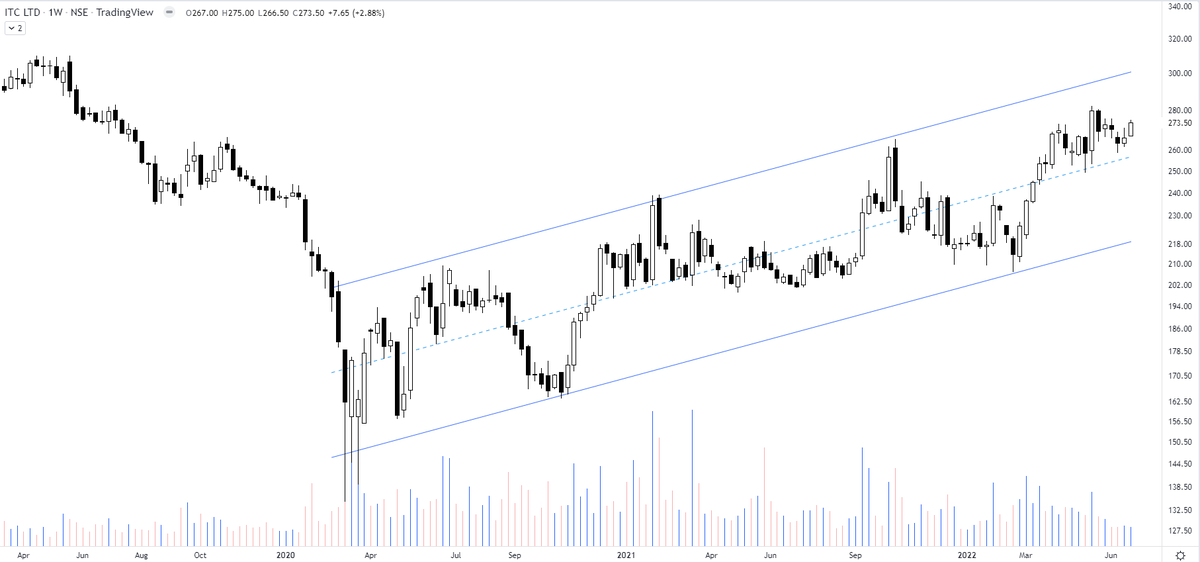
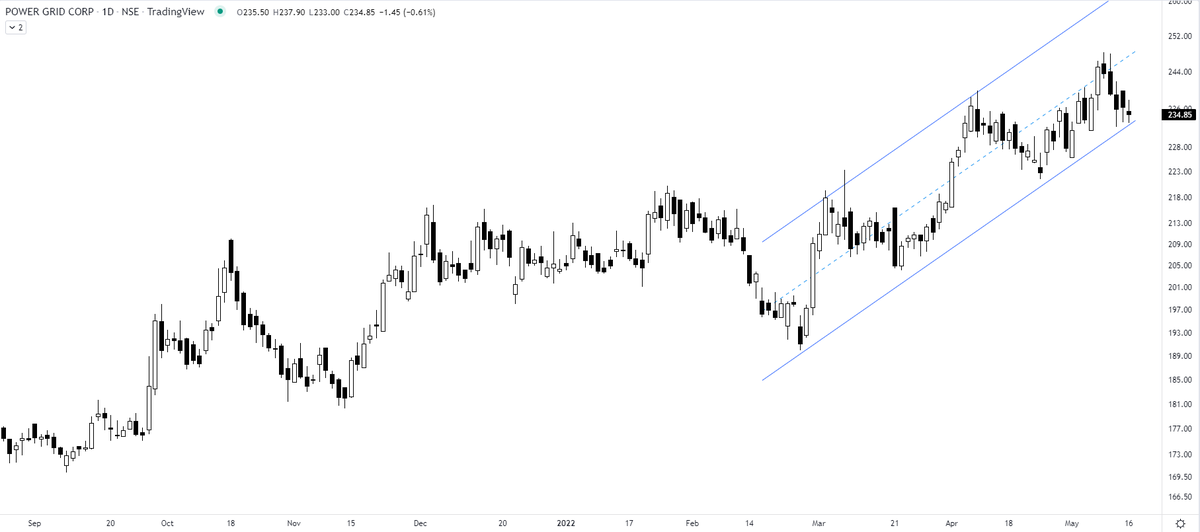
ITC - how beautifully the price patterns work. All of a sudden an increased momentum right from the support of the channel boundary. Has a minor resistance to nail down in the middle.
— The_Chartist \U0001f4c8 (@charts_zone) March 18, 2022
Anyone observing it would have gone aggressive at lower end for a swing move pic.twitter.com/YqxkdFlJXQ