SAnngeri Categories Screeners
7 days
30 days
All time
Recent
Popular

Except ici, none others went above O=H.
(I personally never trade based on O=H/ O=L; area is prone to spikes.)
But, when index & heavyweights have O=H at same time, it lends more credibility. -> today Gapup buyers were not in control.
(I personally never trade based on O=H/ O=L; area is prone to spikes.)
But, when index & heavyweights have O=H at same time, it lends more credibility. -> today Gapup buyers were not in control.
#nifty #hdfc #infy #hdfcbank #icicibank #tcs have nearly O=H. (Give or take few points)
— Pankaj DP (@voPAtrader) March 10, 2022
Rarely this happens.


RSI is an oscillator which is set to fluctuate between 0 and 100. Adding an MA to it would give a perspective of its location, at the max. Its never support or resistance
Aneesh ji, Like in PA we have undercut and reclaim of some major MA some significance, does it have any significance in RSI?
— Prakhar (@StocksbyPrakhar) May 12, 2022

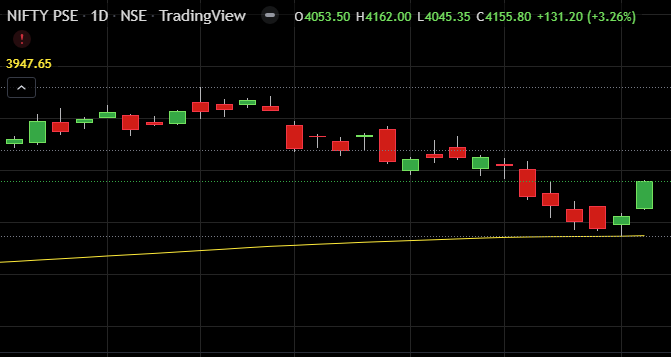

Conditions
rsi >50
RSI avove ma60
Price above ema 60
It is for indicators lovers.. i see rarely but as per my experience enough setup if one is follow with descipline
rsi >50
RSI avove ma60
Price above ema 60
ITC
— Pramod Sharma\U0001f549\ufe0f\U0001f1ee\U0001f1f3 (@itspramods) March 29, 2022
Try this combo RSI 60 period on 60 min chart
Backtest and tell me result.
Rsi/ma crossover abovev50 level pic.twitter.com/In3xrgWQz0
It is for indicators lovers.. i see rarely but as per my experience enough setup if one is follow with descipline


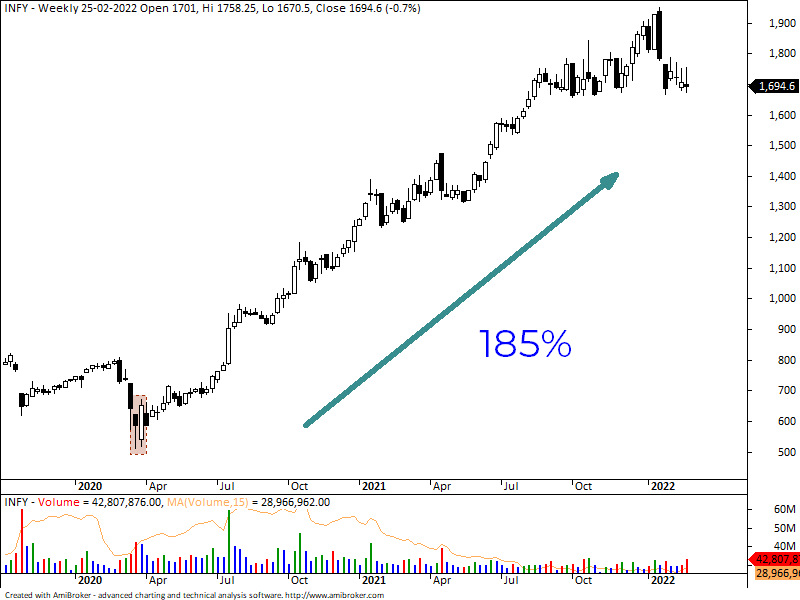



Jab tak ki meri book nahi aati, ye kar lo:
1. Go through Zerodha Varsity chapters on Technical Analysis at least 2 times.
2. Then read 'Technical Analysis Explained' by Martin Pring
3. Finally read 'Price Action bar by bar' by Al Books (Not for casual reader).
1. Go through Zerodha Varsity chapters on Technical Analysis at least 2 times.
2. Then read 'Technical Analysis Explained' by Martin Pring
3. Finally read 'Price Action bar by bar' by Al Books (Not for casual reader).
Sir @DillikiBiili , could you please suggest a book for technical analysis ?
— Pawan Yadav (@pawan_yadav86) March 25, 2022