SAnngeri's Categories
SAnngeri's Authors


Latest Saves


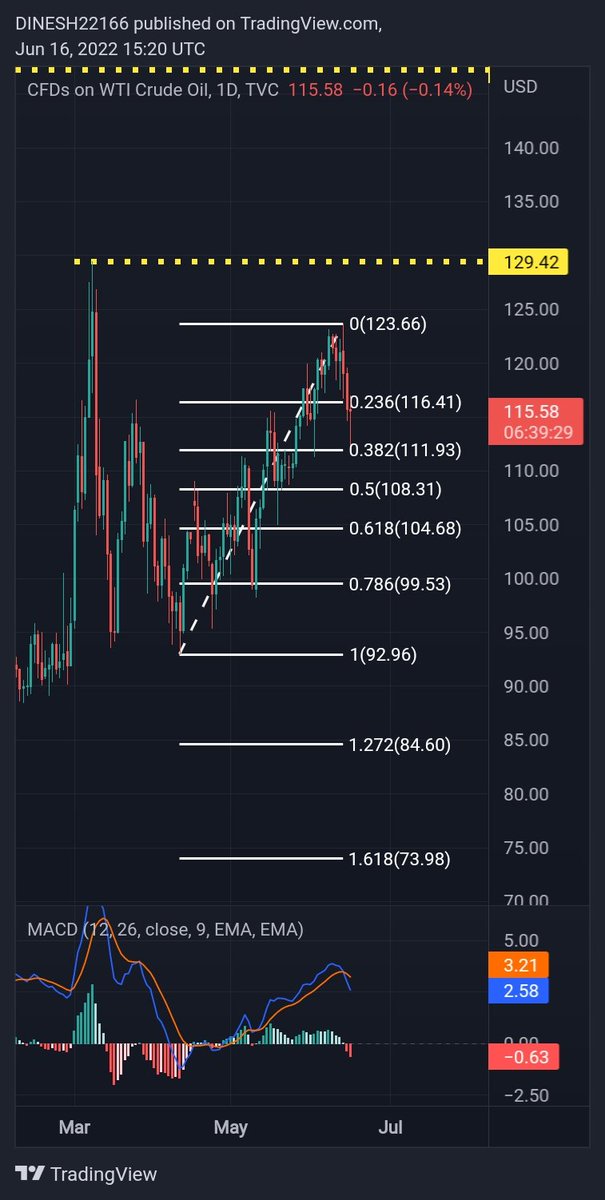
On the last two instances, when #Brent #CrudeOil crossed 90, NIFTY (in Blue - Left scale) underwent Correction both the times. This is the third such instance.
— Piyush Chaudhry (@piyushchaudhry) February 12, 2022
Below 90, NIFTY & Brent have had positive correlation, with 90 acting as an inflection point & causing the Divergence. pic.twitter.com/Q9dj8YFpuV

#BITCOIN
— Mayank Narula (@Mayank_Narula1) March 5, 2022
Pending RSI divergence on monthly chart which requires a dip under 13805 to get resolved.
But monthly RSI divergences can go on for years before the resolution.
Best case scenario will be panic dump over next few months. pic.twitter.com/hi67hMg9sZ


Was looking at #BajajFinance chart once again. I am not able to complete 5 waves yet...hmmm...\U0001f928
— Harsh / \ud5c8\uc26c (@_Harsh_Mehta_) June 17, 2022
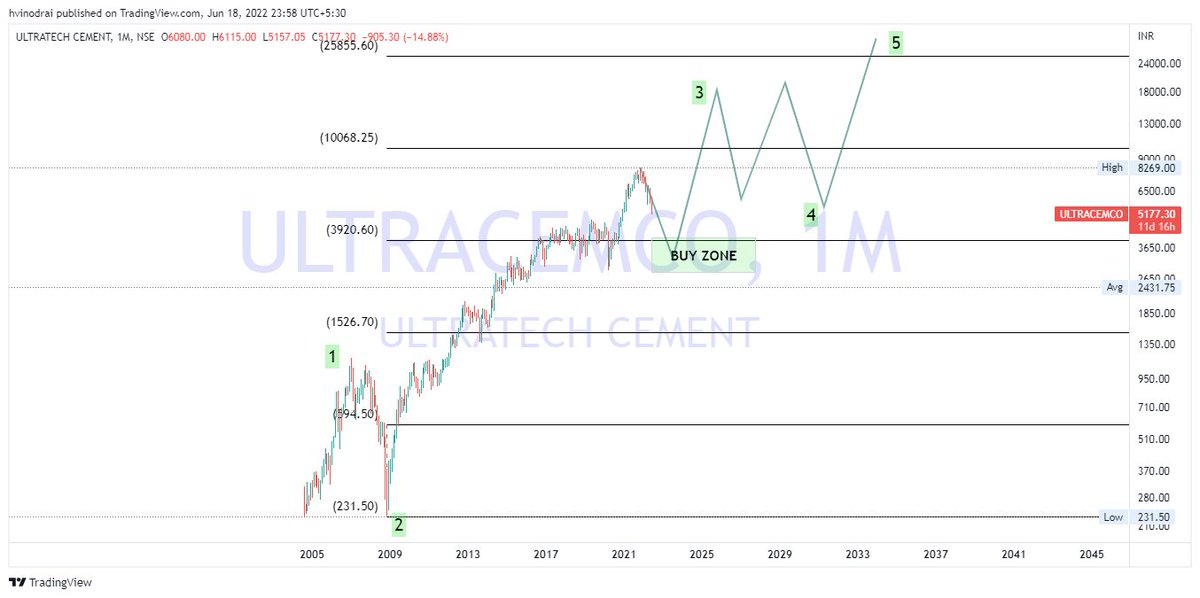
As posted earlier, the drop is still 4th (invalidation below 4500).
And target still remains open for 10K+ https://t.co/DozJzNhuuI pic.twitter.com/jPRaEQoPH3


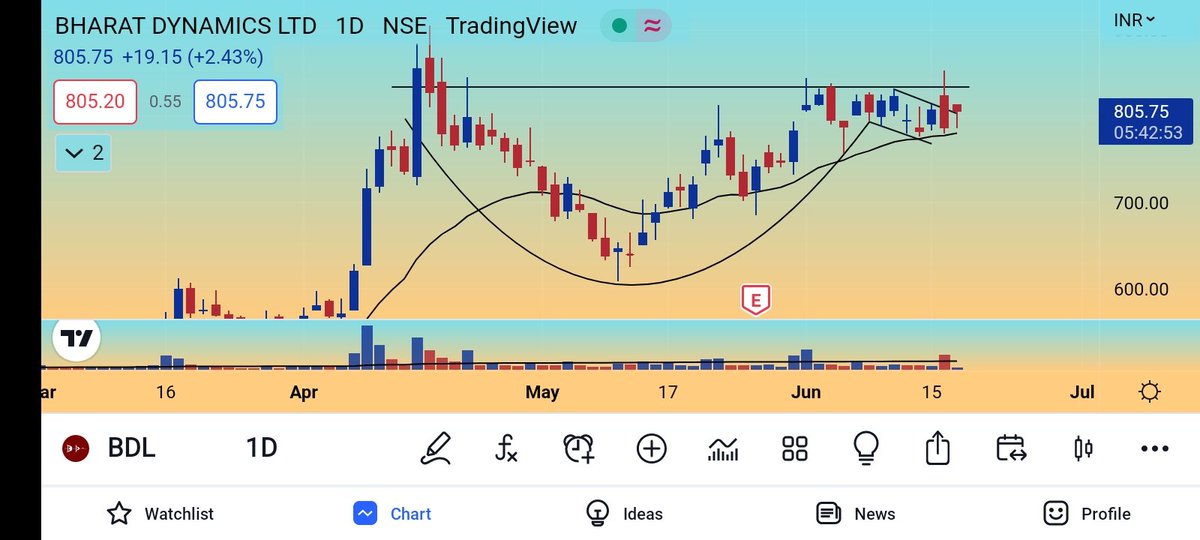
- CCI never went into bearish territory
- Relative strength hits new highs
Expecting a strong move next week! https://t.co/rDCnSOFkxs
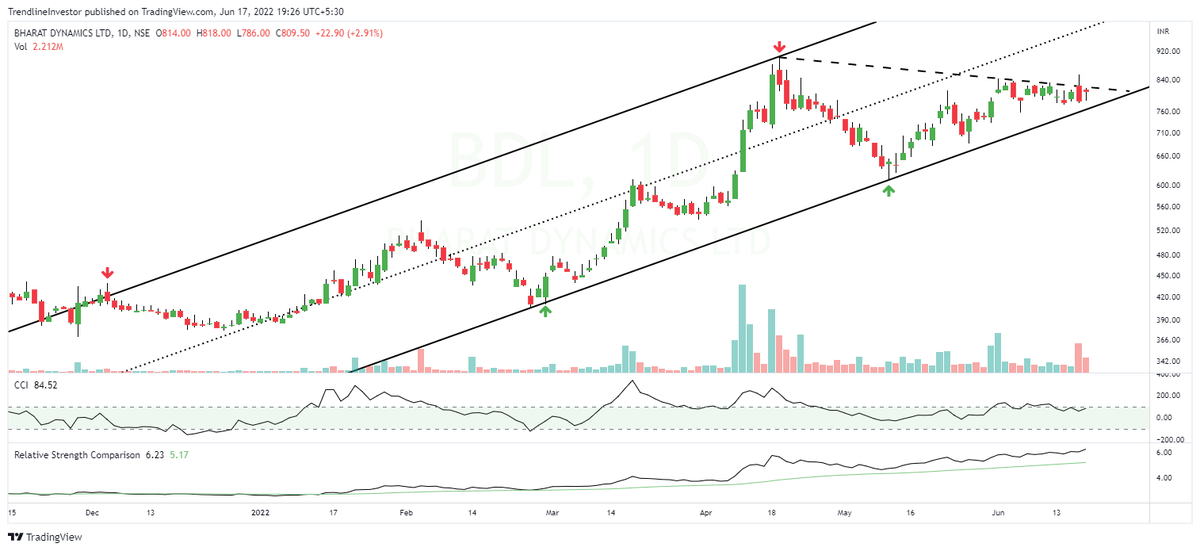
The consolidation I mentioned in #BDL is in progress and if I want to take fresh/add more to the current positions this is one way to do it - Trendline retest!
— Trendline Investor (@dmdsplyinvestor) May 4, 2022
One can also wait for a reversal confirmation before adding. https://t.co/qcUntm9NEz pic.twitter.com/5lgT8aZZpB


This exercise will tell you about your inherent strengths & weaknesses. 👇👇
How to record a trading journal (TJ) & what to analyze?
— The_Chartist \U0001f4c8 (@charts_zone) December 14, 2021
What is in a TJ?
Buy Date
Stock Name
The time frame you analyzed (D/W/M)
Long/Short?
Buy Price
SL
Sell Price
Risk took (% of capital)
Sell date
No. of days held
P/L
P/L as % of capital
Buy Reason?
Invested capital/trade pic.twitter.com/WnrvmYuOV0