Mollyycolllinss Categories Science
It's time, my friends 🤩🤩
[Thread] #ProjectOdin
The Alliance has Project Odin ready to go - the new quantum-based internet. #ElonMusk #QVS #QFS #ProjectOdin
— Der Preu\xdfe Parler: @DerPreusse (@DerPreusse1963) January 12, 2021
https://t.co/fO90N78fta

new quantum-based internet #ElonMusk #QVS #QFS
Political justification ⏬⏬
#ProjectOdin

#ProjectOdin #Starlink #ElonMusk #QuantumInternet

😭
The new answer to a 77-year-old problem in data analysis, published today in @naturemethods. Instead of significance tests, use estimation graphics. Our software suite DABEST makes it easy for everyone to visualize effect sizes.https://t.co/UzwXJ7EUC5 pic.twitter.com/VtxyY0xaRM
— Adam Claridge-Chang (@adamcchang) June 19, 2019
https://t.co/hm9NoaU4nr
Open letter to journal editors: dynamite plots must die. Dynamite plots, also known as bar and line graphs, hide important information. Editors should require authors to show readers the data and avoid these plots. https://t.co/0GNKEIUCJL pic.twitter.com/OS9ytEFRZN
— Rafael Irizarry (@rafalab) February 22, 2019
https://t.co/8fKDiKjSWc
Couldn't find D3 code for grouped horisontal box plots that show data points so I made this @mbostock @thisisalfie https://t.co/cQjDPhyZdw pic.twitter.com/y6RNmDB2p3
— Ulrik Lyngs (@ulyngs) June 28, 2017
https://t.co/jkaicC1F2x
made a pkg for pirate plots in ggplot: add any of points/means/bars/CIs/violins \u2013 better than ye olde bar/box plotshttps://t.co/Z2m2kW3hsl pic.twitter.com/npAirPQexM
— Mika Braginsky (@mbraginsky) September 28, 2017
https://t.co/PpxWT4Jef4
See the new #PowerBI visual awesomeness for data points & sources, box-&-whisker plots! https://t.co/dOmgoxWfDE pic.twitter.com/HAUOAMJEJW
— Microsoft Power BI (@MSPowerBI) February 1, 2016
1/
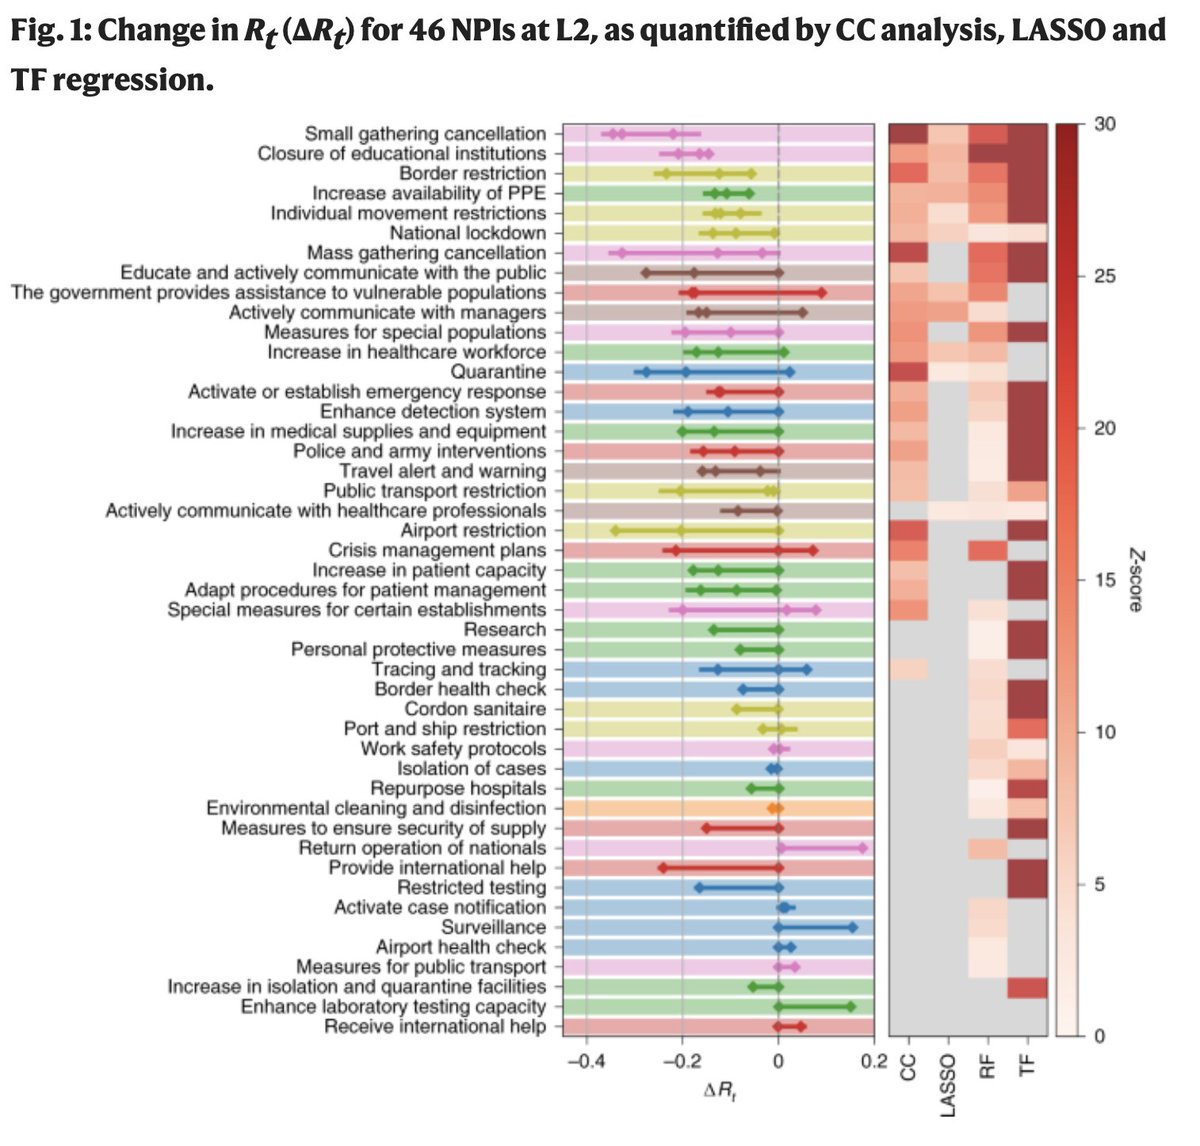
I've recently come across a disinformation around evidence relating to school closures and community transmission that's been platformed prominently. This arises from flawed understanding of the data that underlies this evidence, and the methodologies used in these studies. pic.twitter.com/VM7cVKghgj
— Deepti Gurdasani (@dgurdasani1) February 1, 2021
The paper does NOT evaluate the effect of school closures. Instead it conflates all ‘educational settings' into a single category, which includes universities.
2/
The paper primarily evaluates data from March and April 2020. The article is not particularly clear about this limitation, but the information can be found in the hefty supplementary material.
3/

The authors applied four different regression methods (some fancier than others) to the same data. The outcomes of the different regression models are correlated (enough to reach statistical significance), but they vary a lot. (heat map on the right below).
4/

The effect of individual interventions is extremely difficult to disentangle as the authors stress themselves. There is a very large number of interventions considered and the model was run on 49 countries and 26 US States (and not >200 countries).
5/

A thread on the potential near term catalysts behind why I have increased my position in 4d Pharma @4dpharmaplc (LON: #DDDD):

1) NASDAQ listing. This is the most obvious.
The idea behind this is that the huge pool of capital and institutional interest in the NASDAQ will enable a higher per-share valuation for #DDDD than was achievable in the UK.
Comparators to @4dpharmaplc #DDDD (market capitalisation £150m) on the NASDAQ and their market capitalisation:
Seres Therapeutics: $2.33bn = £1.72bn (has had a successful phase 3 C. difficile trial); from my previous research (below) the chance of #DDDD achieving this at least once is at least
While looking at speculative pharmaceutical stocks I am reminded of why I am averse to these risky picks.#DDDD was compelling enough, though, to break this rule. The 10+ treatments under trial, industry-leading IP portfolio, and comparable undervaluation are inescapable.
— Shrey Srivastava (@BlogShrey) December 16, 2020
Kaleido Biosciences: $347m = £256m. 4 products under consideration, compared to #DDDD's potential 16. When you view @4dpharmaplc's 1000+ patents and AI-driven MicroRx platform (not to mention their end-to-end manufacturing capability), 4d's undervaluation is clear.
Simulation: Riding in car for 120 min w/ infected passenger who seems fine other than a cough every few mins. (1) a lot of SARS-CoV-2 virus (in fine aerosol particles) accumulation in car cabin w/ windows closed; (2) cracking window open slightly = dramatic reduction. #COVID19 pic.twitter.com/bCmrmnLUPG
— Dr. Richard Corsi (@CorsIAQ) April 4, 2020
2/ Related air exchange rates were based on experimental results in literature for mid-sized sedans. Particle deposition to indoor surfaces were accounted for, as the surface to volume ratio in a 3 m3 cab is large. An important outcome was the intake fraction (IF)
3/ Here, IF is the number of particles (or virions in collective particles) inhaled by a receptor DIVIDED BY the number or particles (or virions in collective particles) emitted by an infector.
4/ Integrated over the two hour drive (in this example) the IF for all windows closed & a receptor at rest is 0.08 (8% of what comes out of the infectors respiratory system ends up in the respiratory system of the receptor). 8%! That is a very high intake factor.
5/ With additional ventilation from cracking a window open drops the IF to 0.012 (1.2%) still relatively high. Can get lower by opening more windows.
#ForNature @JohnKerry
Blue whales threatened by ship collisions in busy Patagonia waters
— James Mitchell \u24cb\U0001f42c (@MesMitch) February 1, 2021
Endangered giants face potentially fatal encounters with the 1,000 daily fishing vessels moving through main feeding area off Chile, scientists warn\U0001f43b\u200d\u2744\ufe0f@WeDontHaveTime
#ForNature @JohnKerry
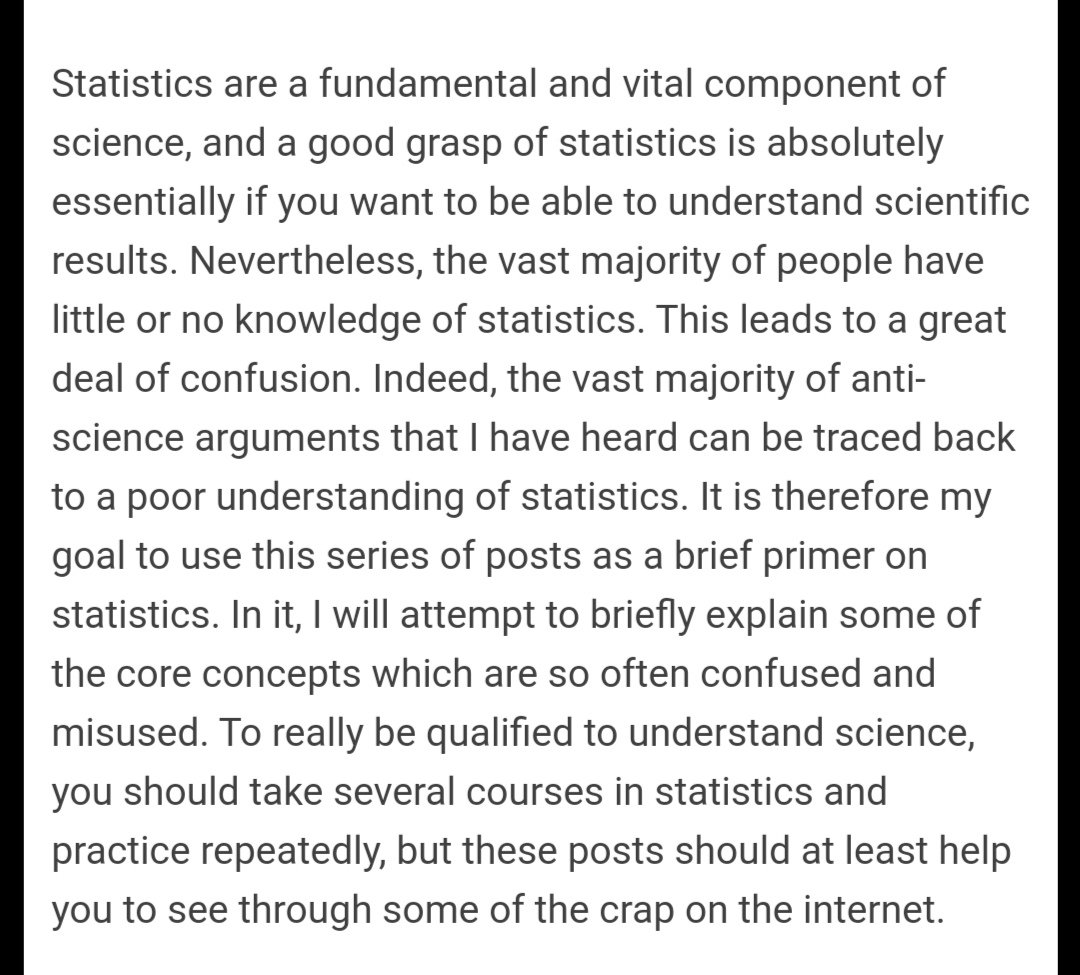
Basic Statistics Part 1: The Law of Large Numbers https://t.co/wUH8eAAIak
#Science #Statistics

Basic Statistics Part 2: Correlation vs. Causation
https://t.co/Azhyl8pDsX (2/7)
Basic Statistics Part 3: The Dangers of Large Data Sets: A Tale of P values, Error Rates, and Bonferroni Corrections
https://t.co/LetN6aEBRM (3/7)
Basic statistics part 4: understanding P values
https://t.co/K8MMMgTCOf (4/7)
Basic Statistics Part 5: Means vs Medians, Is the “Average”


