https://t.co/Azhyl8pDsX (2/7)
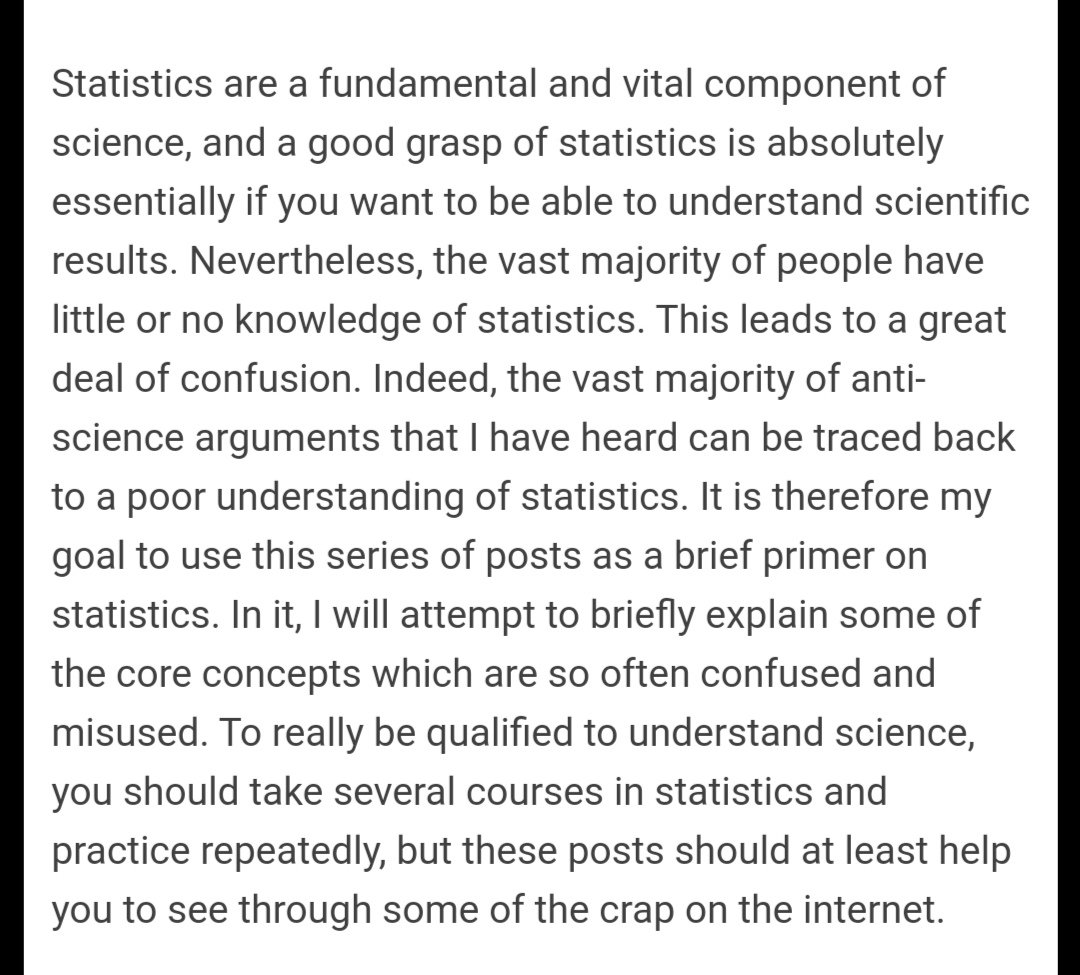
This is a thread on statistics in science: 1/7 (via @LogicofScience)
Basic Statistics Part 1: The Law of Large Numbers https://t.co/wUH8eAAIak
#Science #Statistics
https://t.co/LetN6aEBRM (3/7)
https://t.co/OtVrL0nyIl
Logic is the basis of any scientific argument. This is a thread on rules of logic by @LogicofScience
— The Desi Science Page (@desisciencepage) June 29, 2020
The Rules of Logic Part 1: Why Logic Always Workshttps://t.co/NpxZ5diZoK
1/7
May be mark this thread too for reading later? One on logical fallacies: https://t.co/Z7S9kNsFoI
-End-
Let's talk about logical fallacies:
— The Desi Science Page (@desisciencepage) June 25, 2020
"Perhaps the most common mistake that people make in debates is the use of logical fallacies. This occurs largely because people generally are not taught logical fallacies, and, therefore, don\u2019t recognize them when they use or see them"
1/n pic.twitter.com/P7xVY9Ehln
More from Science

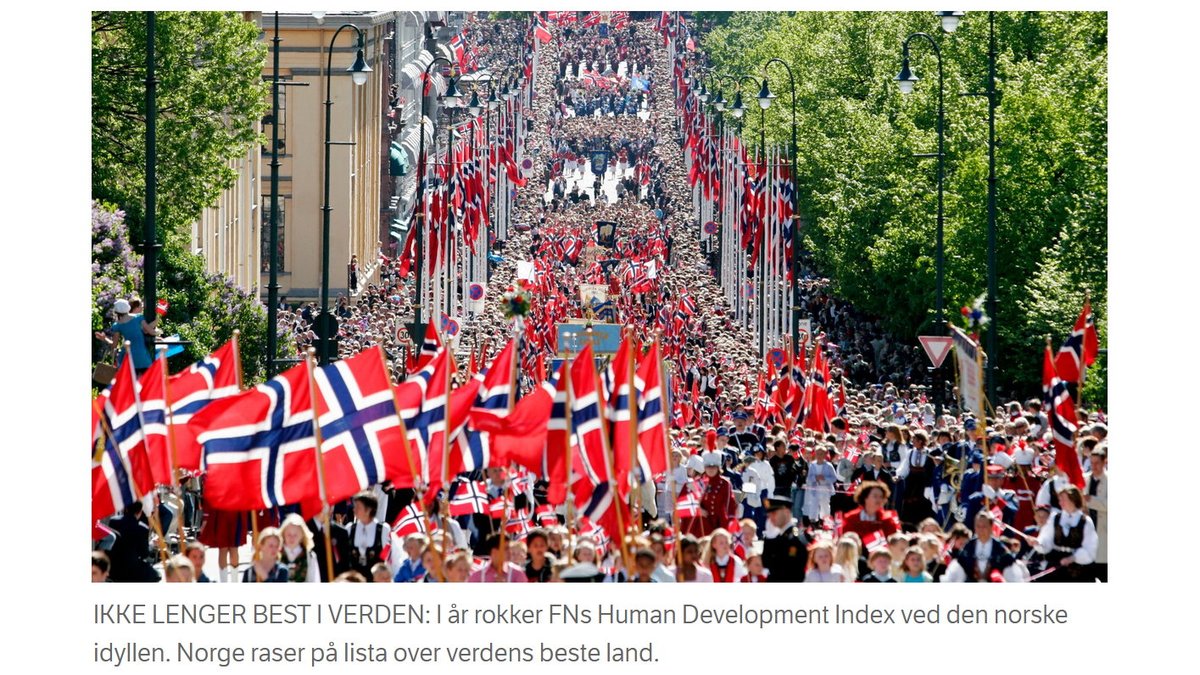
"NO LONGER BEST IN THE WORLD"
UNEP's new Human Development Index includes a new (separate) index: Planetary pressures-adjusted HDI (PHDI). News in Norway is that its position drops from #1 to #16 because of this, while Ireland rises from #2 to #1.
Why?
https://t.co/aVraIEzRfh
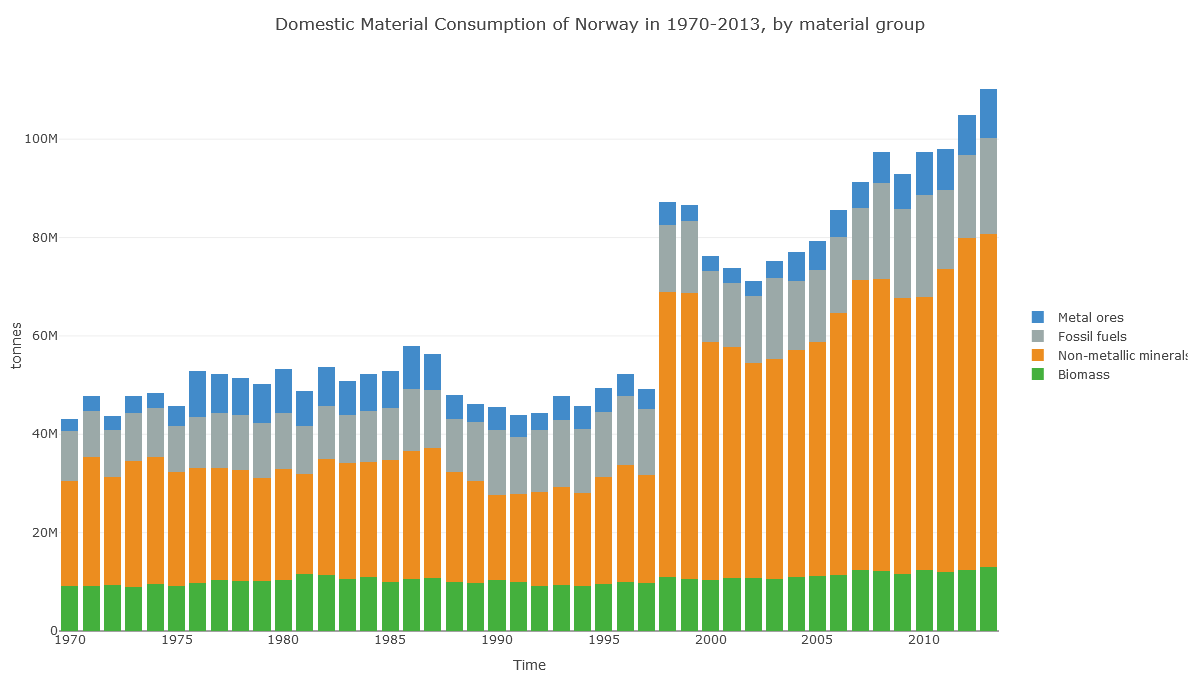
Check out Norway's 'Domestic Material Consumption'. Fossil fuels are no different here to Ireland's. What's different is this huge 'non-metallic minerals' category.
(Note also the jump in 1998, suggesting data problems.)
https://t.co/5QvzONbqmN
In Norway's case, it looks like the apparent consumption equation (production+imports-exports) for non-metal minerals is dominated by production: extraction of material in Norway.
https://t.co/5QvzONbqmN
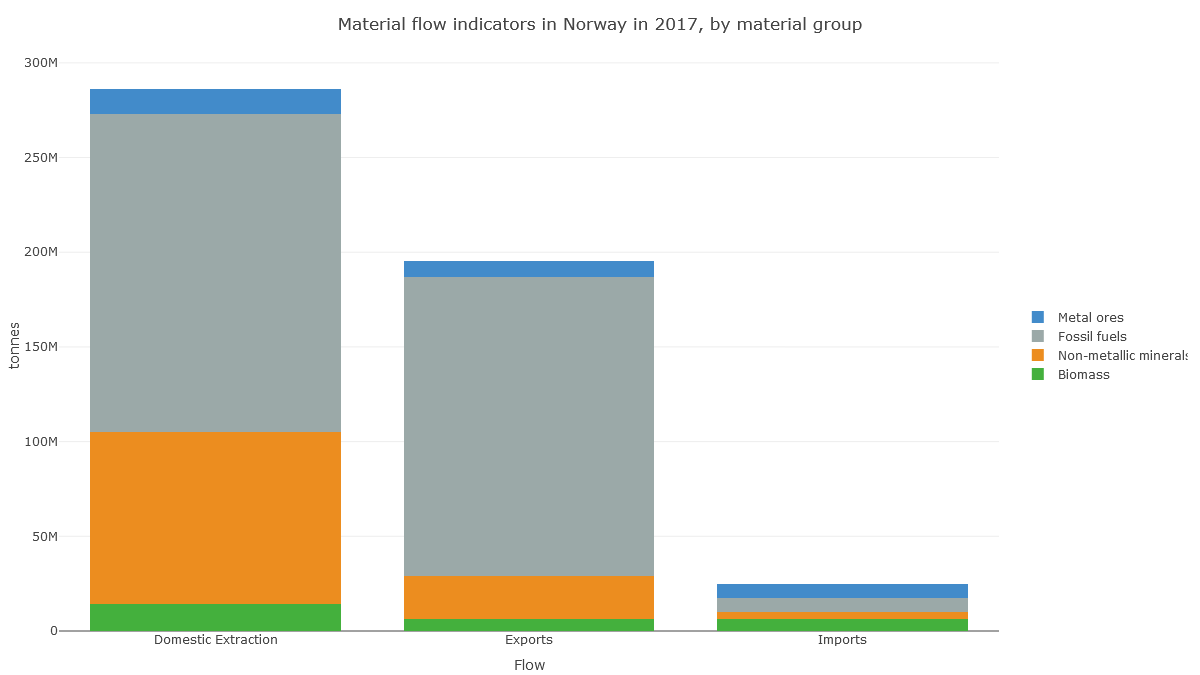
And here we see that this production of non-metallic minerals is sand, gravel and crushed rock for construction. So it's about Norway's geology.
https://t.co/y6rqWmFVWc
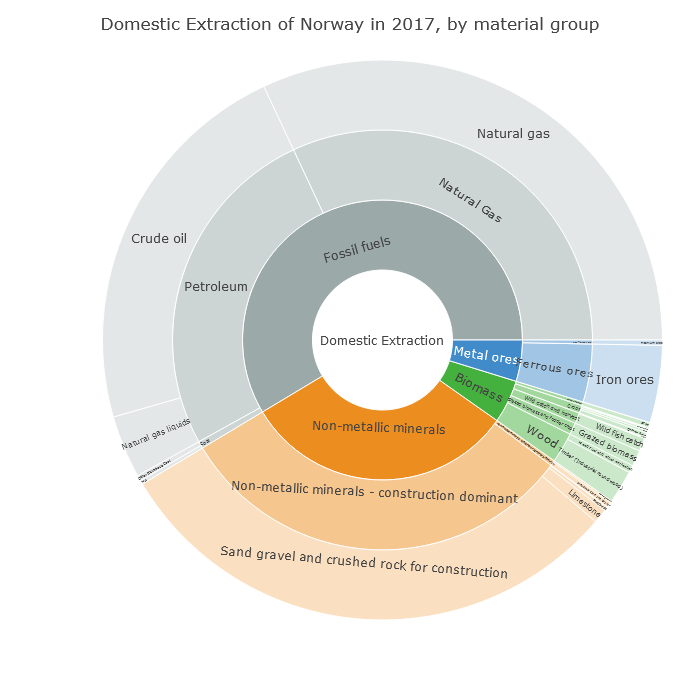
Norway drops 15 places on the PHDI list not because of its CO₂ emissions (fairly high at 41st highest in the world per capita), but because of its geology, because it shifts a lot of rock whenever it builds anything.
UNEP's new Human Development Index includes a new (separate) index: Planetary pressures-adjusted HDI (PHDI). News in Norway is that its position drops from #1 to #16 because of this, while Ireland rises from #2 to #1.
Why?
https://t.co/aVraIEzRfh
Check out Norway's 'Domestic Material Consumption'. Fossil fuels are no different here to Ireland's. What's different is this huge 'non-metallic minerals' category.
(Note also the jump in 1998, suggesting data problems.)
https://t.co/5QvzONbqmN
In Norway's case, it looks like the apparent consumption equation (production+imports-exports) for non-metal minerals is dominated by production: extraction of material in Norway.
https://t.co/5QvzONbqmN
And here we see that this production of non-metallic minerals is sand, gravel and crushed rock for construction. So it's about Norway's geology.
https://t.co/y6rqWmFVWc
Norway drops 15 places on the PHDI list not because of its CO₂ emissions (fairly high at 41st highest in the world per capita), but because of its geology, because it shifts a lot of rock whenever it builds anything.




Hard agree. And if this is useful, let me share something that often gets omitted (not by @kakape).
Variants always emerge, & are not good or bad, but expected. The challenge is figuring out which variants are bad, and that can't be done with sequence alone.
You can't just look at a sequence and say, "Aha! A mutation in spike. This must be more transmissible or can evade antibody neutralization." Sure, we can use computational models to try and predict the functional consequence of a given mutation, but models are often wrong.
The virus acquires mutations randomly every time it replicates. Many mutations don't change the virus at all. Others may change it in a way that have no consequences for human transmission or disease. But you can't tell just looking at sequence alone.
In order to determine the functional impact of a mutation, you need to actually do experiments. You can look at some effects in cell culture, but to address questions relating to transmission or disease, you have to use animal models.
The reason people were concerned initially about B.1.1.7 is because of epidemiological evidence showing that it rapidly became dominant in one area. More rapidly that could be explained unless it had some kind of advantage that allowed it to outcompete other circulating variants.
Variants always emerge, & are not good or bad, but expected. The challenge is figuring out which variants are bad, and that can't be done with sequence alone.
Feels like the next thing we're going to need is a ranking system for how concerning "variants of concern\u201d actually are.
— Kai Kupferschmidt (@kakape) January 15, 2021
A lot of constellations of mutations are concerning, but people are lumping together variants with vastly different levels of evidence that we need to worry.
You can't just look at a sequence and say, "Aha! A mutation in spike. This must be more transmissible or can evade antibody neutralization." Sure, we can use computational models to try and predict the functional consequence of a given mutation, but models are often wrong.
The virus acquires mutations randomly every time it replicates. Many mutations don't change the virus at all. Others may change it in a way that have no consequences for human transmission or disease. But you can't tell just looking at sequence alone.
In order to determine the functional impact of a mutation, you need to actually do experiments. You can look at some effects in cell culture, but to address questions relating to transmission or disease, you have to use animal models.
The reason people were concerned initially about B.1.1.7 is because of epidemiological evidence showing that it rapidly became dominant in one area. More rapidly that could be explained unless it had some kind of advantage that allowed it to outcompete other circulating variants.