
Measure the last 5-7 daily candles wick to wick (eliminating any outliers) and calculate the average move the stock makes.
Finding key levels.
Lately I’ve noticed a lot of you guys have been asking why are @AdamSliverTrade and other League members levels a little different than the ones you’ve mapped out. Here’s a little information that will help you understand why and better the levels you create!
Measure the last 5-7 daily candles wick to wick (eliminating any outliers) and calculate the average move the stock makes.

The average range in the example above is about 2.00 (meaning that on any given day you could expect the stock to move 2 points)
20-25% of 2.00 = .40-.50
More from Tradingthread

So I'll give you a breakdown on which website I use to check my DD along with mainly using my PLATFORM as the MAIN source of information. But other websites are also used. . Then I will provide you with a youtuber whose name is RILEY ..
his content from the playlist start with "how to read stock charts". It's precise and on point and short enough for you to get through this week even if you did one video tonight .. I like his teaching method .. he's slow and very easy to understand
As for DD. It comes from many factors. Mainly the trading platform itself has updated news posted on the ticker you want to trade.
https://t.co/1f8wQs1LcA
Really liking this website it has breakdown of the financials & summary of SEC filings. (con'd)
Also a whole bunch of other stuff that it focuses on the companies that you search. As for what I look for?
10-K & 10-Q.
Read 8Ks ..company updates
Also look to see if they did an recent Offerings (S-4 filings)
Also look to see S-3 filings for upcoming dilutions.
cont'd
https://t.co/nxP0hAJ4UH (Great place for quick articles on many stocks that are posted by analysts who do very good work digging info)
https://t.co/KsYqlmTlQ8 for quick news info
https://t.co/v5xGZqWhbn For constant world news

A COMPLETE BREAKDOWN OF MY MOMENTUM DAY TRADING PROCESS.
[THREAD]
A process is just a set of rituals you complete consistently every single day to achieve a certain outcome (profit).
A process requires an edge which is simply a statistical advantage you have over other players. A strong psychological state can be considered a bonus edge.
I believe that trading can be split into three elements:
1) Knowledge and idea generation
2) Method and trade execution
3) Risk management and mindset
Each element is necessary and it builds a solid foundation in your trading process.
These factors make up the trading trinity.
MY SCANNING PROCESS:
In PM, I look for:
- Top gainers (40%+)
- Notable volume on gappers
- News or catalysts (to justify gap)
- Float (<50M)
- Market cap (<500M)
- Range (check daily)
- Price (<25)
- Stock personality (check daily)
- Filings (cash on hand and offering potential)
I like to use websites such as:
- https://t.co/dGrDjwtOR8
- https://t.co/Vc256oZCre
- https://t.co/AFrA2ebGr6
- https://t.co/N9nDmqz54E
- https://t.co/0aEt36amzx
- https://t.co/K5b5oercFQ
- https://t.co/VogPh4QNHM
-


You May Also Like


✨📱 iOS 12.1 📱✨
🗓 Release date: October 30, 2018
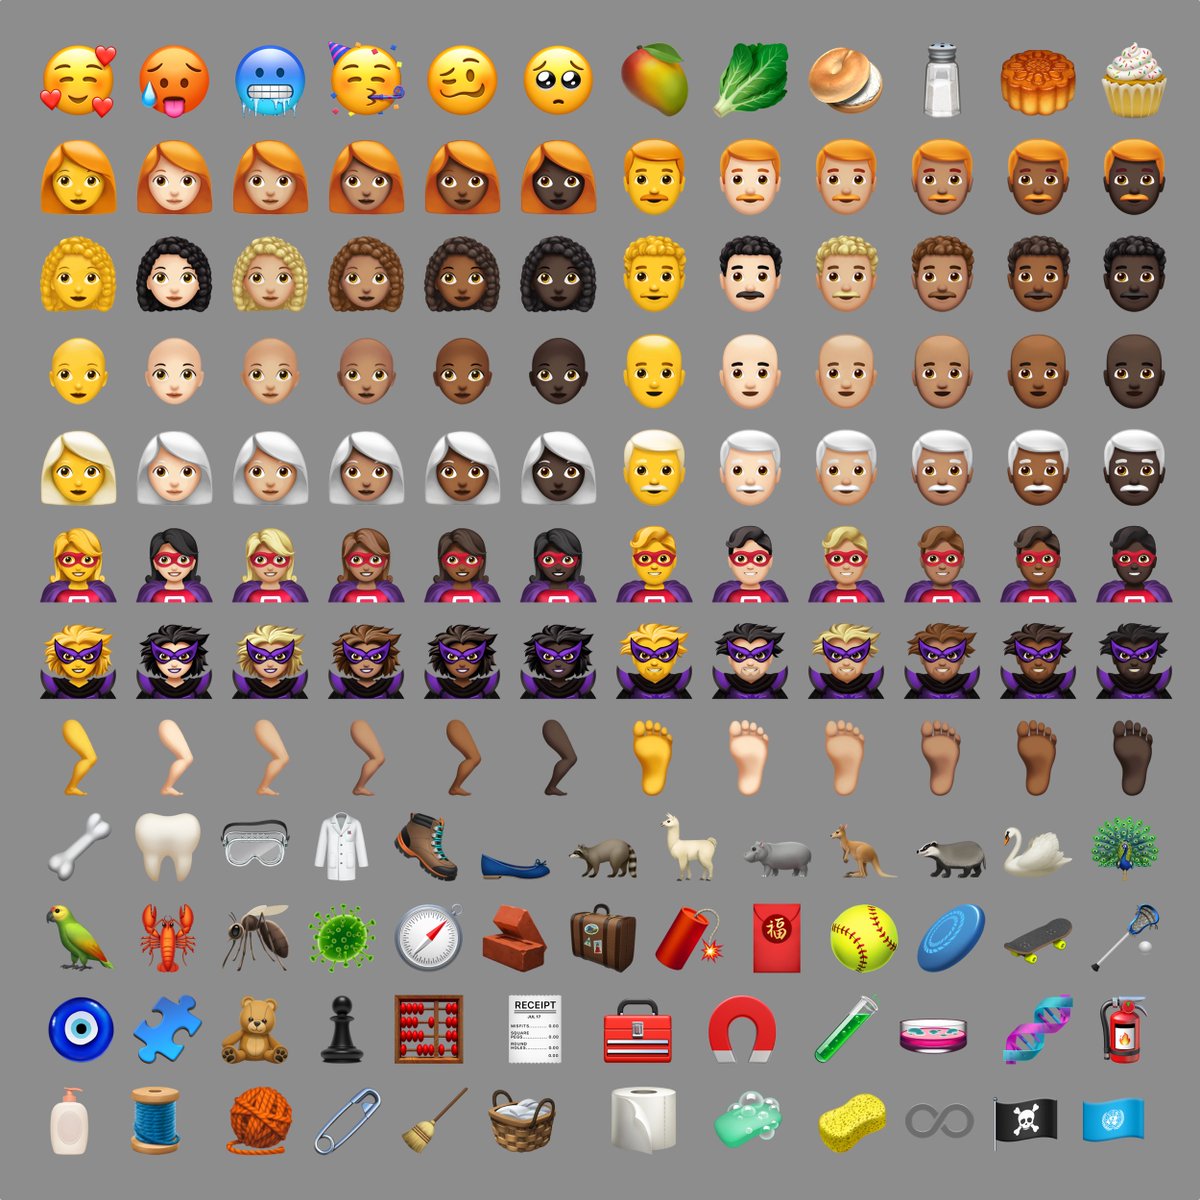
📝 New Emojis: 158
https://t.co/bx8XjhiCiB
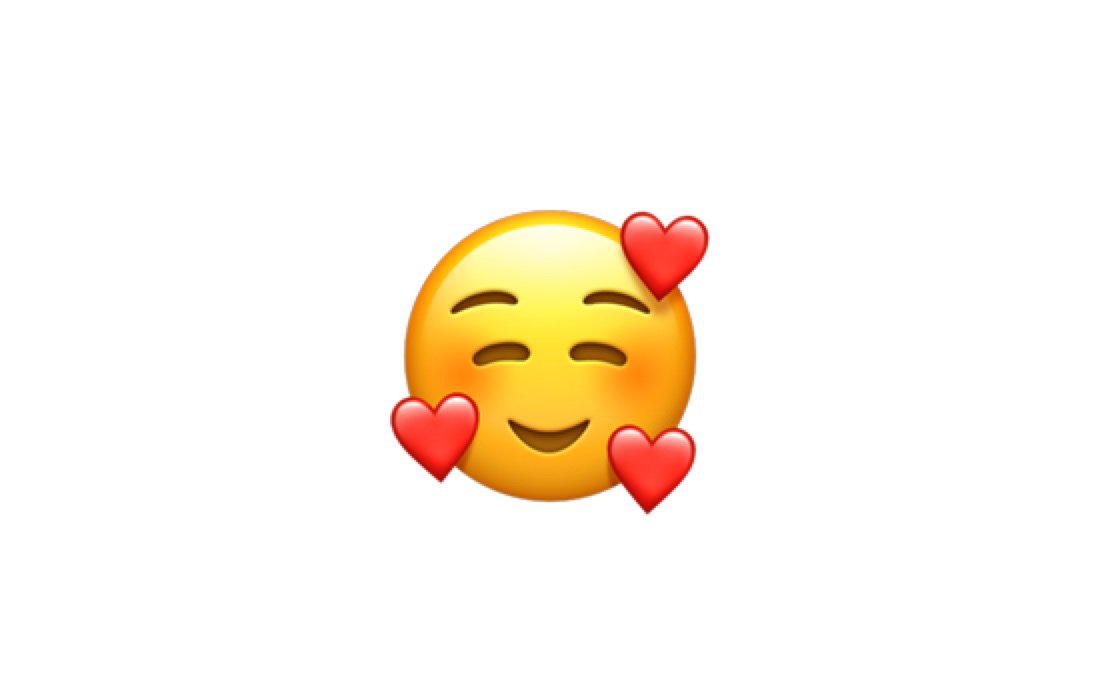
New in iOS 12.1: 🥰 Smiling Face With 3 Hearts https://t.co/6eajdvueip
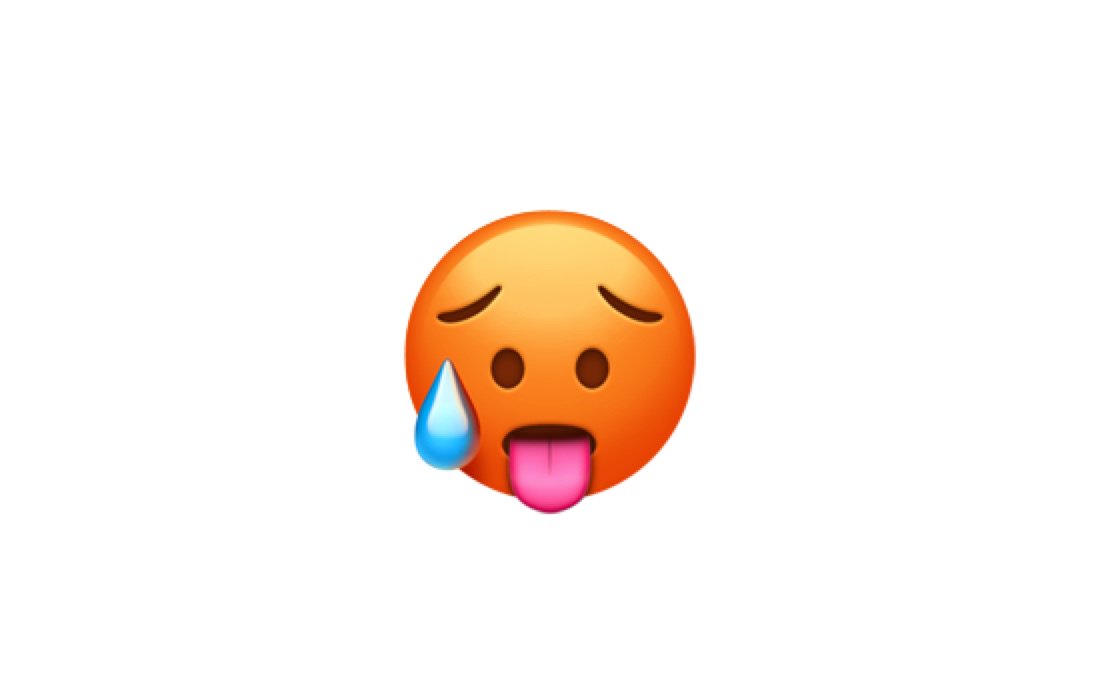
New in iOS 12.1: 🥵 Hot Face https://t.co/jhTv1elltB
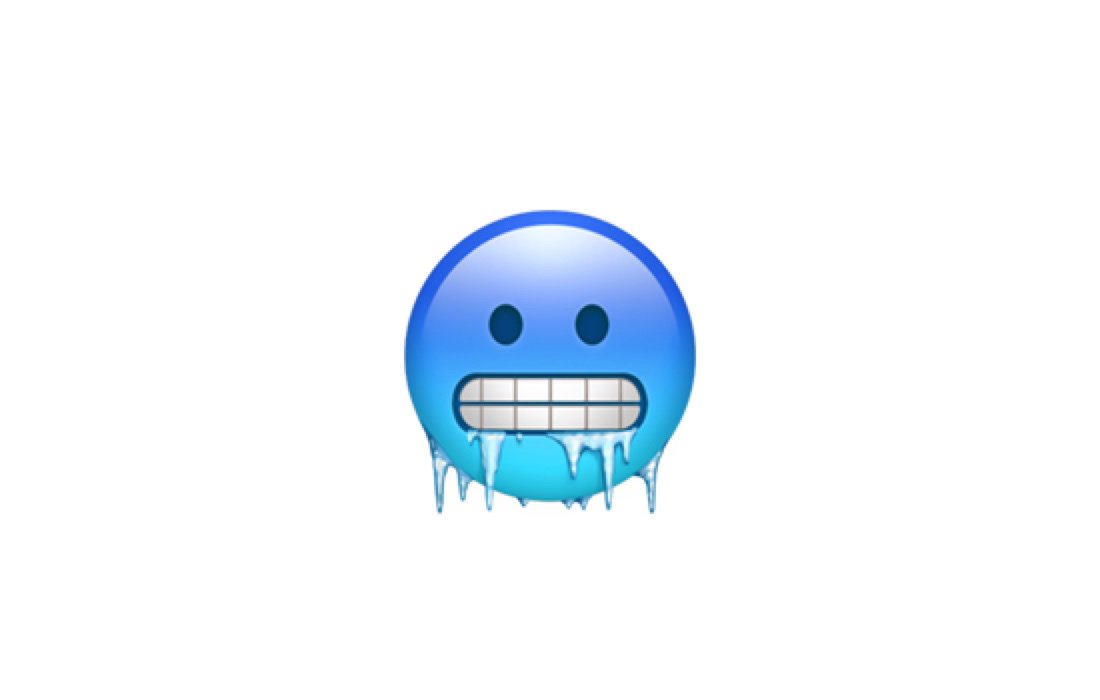
New in iOS 12.1: 🥶 Cold Face https://t.co/EIjyl6yZrF
New in iOS 12.1: 🥳 Partying Face https://t.co/p8FDNEQ3LJ

🗓 Release date: October 30, 2018
📝 New Emojis: 158
https://t.co/bx8XjhiCiB
New in iOS 12.1: 🥰 Smiling Face With 3 Hearts https://t.co/6eajdvueip
New in iOS 12.1: 🥵 Hot Face https://t.co/jhTv1elltB
New in iOS 12.1: 🥶 Cold Face https://t.co/EIjyl6yZrF
New in iOS 12.1: 🥳 Partying Face https://t.co/p8FDNEQ3LJ


