THREAD DOWN BELOW FOR TRADING
Within this thread I will go over educational content you can read and watch, chart patterns, best platforms to use and more
$prog $metx $nept $bxrx

Rules that i follow on a day to day basis
1) Make sure I have a plan when buying a stock
2) Move SL up as go along
3) Stay strict with my support and resistance levels
4) Scale as the stock price moves up
My favourite book to read
- How to day trade for a living by Andrew Aziz
-
The exponential moving average (EMA) is a technical chart indicator that tracks the price of an investment (like a stock) over time. The EMA is a type of weighted moving average (WMA) that gives more weighting or importance to recent price data.
https://t.co/KH8LGUrRmO
Moving average (MA) a used technical indicator that smooths out price trends by filtering out the “noise” from random short-term price fluctuations. When asset prices cross over their moving averages, it may generate a trading signal for technical traders. https://t.co/99FpNPVwHo
Other good YouTube channels you could learn from are
- Wysetrade
- Forte Capital Management
- The Trading Channel
- Rayner Teo
MUST READ
- This link includes all types of trading tools you can use to master trading https://t.co/DrprMjrsVc
Sec fillings
SEC Filings are regulatory documents that companies and issuers of securities must submit to the Securities and Exchange Commission (SEC) on a regular basis.
How to read these fillings https://t.co/boTO4hFE0u
How to buy the fush strategy
https://t.co/I3izo65pVw
Gravestone dogi candle formation. This is a bearish reversal candle stick, this could help you with taking profits when needed or entering a short position.
Watch video in link for powerful doji candles
https://t.co/XhLyiPnjr2
A dragonfly doji is the opposite! This a bullish signal which indicates a reversal to the up trend. (Hammer candle) I use this quite a bit to indicate a reversal! Sellers drying and buyers entering!
Videos to watch on Support and Resistance
https://t.co/jjAtcxIsmp
https://t.co/fWmzpGi9bh
https://t.co/eOLK2BioiQ
Candle sticks
https://t.co/fWmzpGi9bh
https://t.co/fVuoAonqb6
How to find plays
No two ways to go about it but twitter is now a great way to find top plays using other traders to your advantage is key such as @MTradess @3_Green_Candles @jose_dehoyos18 @bvllish_trader @Mini_Tradez @BoaTrading @ripster47 @StockSwingAlert @barnimal
...
- pre-market gainers, get up a few hours early and analyse the top gainers in pre market and draw up support and resistance. You can use Trading view in order to find top gainers or on webull.
- Screen time, previous days runner and hours of charting is how I find plays
What platform to use
In America as far as I'm aware WEBULL is the best platform to use https://t.co/6CVjtMPRSQ
In the UK IBKR, T212 and Tradezero are good to use.
Price target
Based on resistance. $METX looking at the chart your next resistance point is 0.57, you scale some here 25% and raise SL up. Next resistance point is 0.63 then 0.7. Scale at these key areas. Having a $5 PT isnt really going to get you far, keep scaling.
Level 2 time and sales by @LunarAces https://t.co/yDRdSjeenb
Swings - good write up by @moetrades https://t.co/Y83oG3npeK
Full beginner course I highly recommend to watch https://t.co/0c3tCjxFko
Chart patterns to learn
https://t.co/yQ7SrwZZ7B
Scanners set ups
Momentum - Trade ideas https://t.co/XSOxVLPoAR
Top gainers - Webull https://t.co/sbtA5nivUr
Swings - FINVIZ
https://t.co/XEcPwyQt03
entry and exit strategies
- Resistance levels are key, make sure you them drawn before every play

https://t.co/lvctDTNB28
How to read charts
- This is a mixture of all the content provided in this thread but when looking at charts its key to zoom out and go through the 30min, 1day and 5min chart.
https://t.co/dCkBT0Fv81
Trendlines and how to use volume
https://t.co/nVtRcIKcY8
https://t.co/q9kUgfpGeW

More from Tradingthread

Thread of my threads:

"Reading the Tape" / Level 2 / Time and


EMAs /


Supply and


Position sizing, risk management and trading around your
I’m using Twitter as my trading journal. Feel free to follow along and learn with me. I’ll post the resources I’ve found most valuable below. I’ve attached my evolving trading rules. As you can see, I am continually learning from my mistakes and feel more prepared each day.


Wave theory resources:

https://t.co/zMLJx0Posg

Recommend checking out @StockDweebs newsletter. I don’t practice wave theory myself but have found his picks highly accurate and like to correlate them with my own.

YouTube channels:

TrendSpider @TrendSpider
smithsintheblack @RobInTheBlack
Sara Sabatino @ssabatino84
_ms_izzy @_ms_izzy
Learn to Day Trade @TrueBubbleHead
StockDweebs @StockDweebs
watchjoshtrade @watchjoshtrade
BullTradeFinder @BullTradeFinder
MagicMike @magicmiketrader
Due Diligence Thread 🚨👇

In this thread I will be revealing to you guys my step by step process on how I do my due diligence on any ticker along with the process of how I find good setups and what resources and websites do I use to do it.

Step 1: Finding Good Chart Setups (continued)

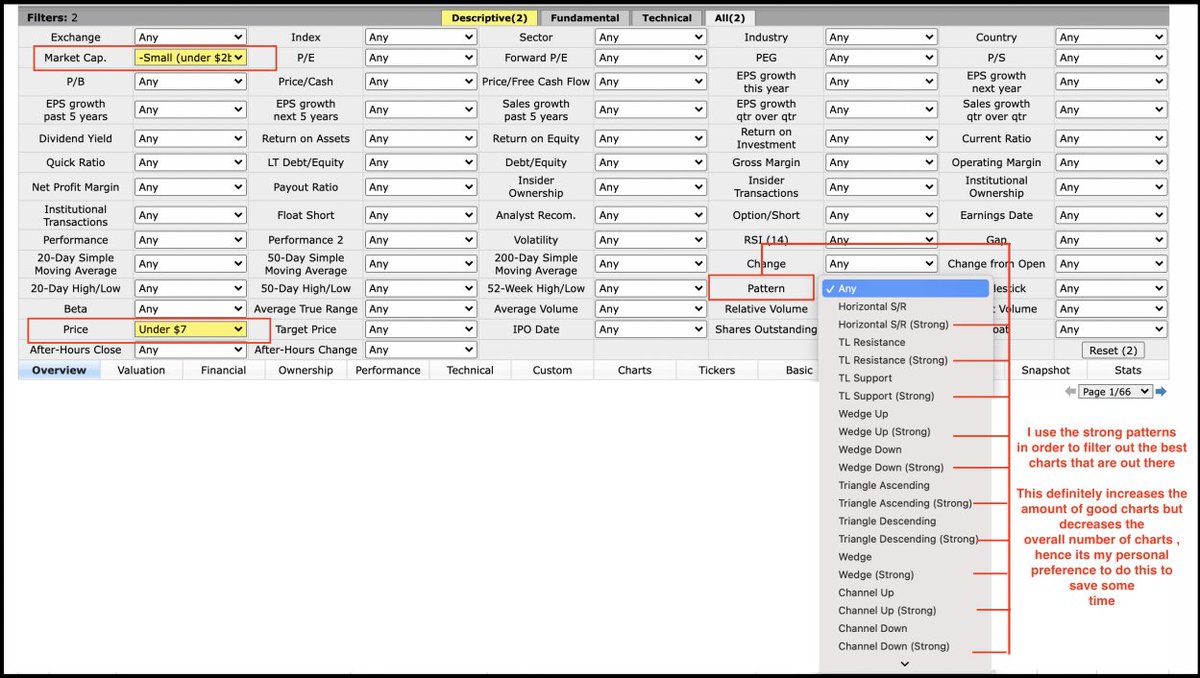
Attached below is my personal finviz screener settings which I use to look at charts and how I
change some of the settings to my own preferences.
Site Reference:
https://t.co/liI2ktnHhz

PS: Sometimes I don't even select any pattern


My favorite bullish chart setups that I personally look out for initiating swing positions:
1-) Falling Wedge Pattern
2-) Ascending Triangle Pattern
3-) Fish Hook / Oversold Bounce Pattern
4-) Channel Up Pattern
5-) Descending Triangle Breakout Pattern ( Towards Upside)

Step 2: Checking for Offerings

Once I have found a good chart, with a high risk reward ratio, the immediate first thing that I
do is to look out for any signs of upcoming offering. Since I don’t want to get caught in
offerings , these are the two things that I lookout for.

Step 2: Checking for Offerings (continued)
1-) Firstly, I look for whether the company had made any recent offerings in the last two months, if yes then there are less chances of new offerings.

You May Also Like