The is a tech bubble in the stock market, and it will burst soon. The question is, which of the #NGS companies below will come out stronger from the stock market tech bubble bursting? $ILMN $PACB @nanopore @MGI_BGI
Who will come out stronger from the stock market tech bubble in #NGS? https://t.co/TDn5J0glhi
— Albert Vilella (@AlbertVilella) January 11, 2021
More from Trading

12 TRADING SETUPS used by professional traders:🧵
Collaborated with @niki_poojary
Here's what you'll learn in this thread:
1. Capture Overnight Theta Decay
2. Trading Opening Range Breakouts
3. Reversal Trading Setups
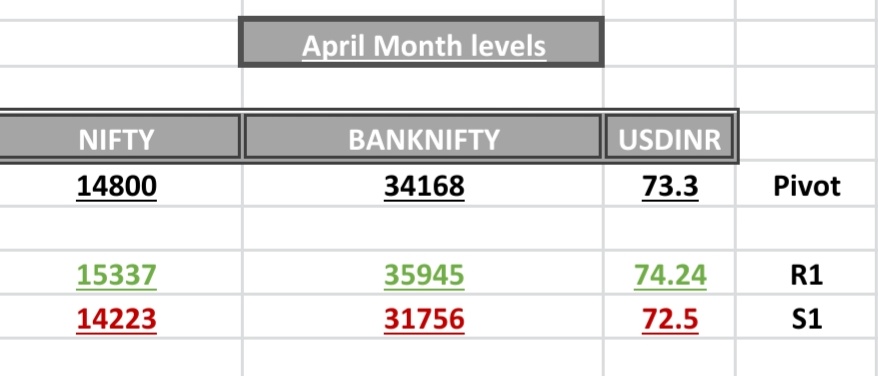
4. Selling strangles and straddles in Bank Nifty
6. NR4 + IB
7. NR 21-Vwap Strategy
Let's dive in ↓
1/ STBT option Selling (Positional Setup):
The setup uses price action to sell options for overnight theta decay.
Check Bank Nifty at 3:15 everyday.
Sell directional credit spreads with capped
@jigspatel1988 2/ Selling Strangles in Bank Nifty based on Open Interest Data
Don't trade till 9:45 Am.
Identify the highest OI on puts and calls.
Check combined premium and put a stop on individual
@jigspatel1988 3/ Open Drive (Intraday)
This is an opening range breakout setup with a few conditions.
To be used when the market opens above yesterday's day high
or Below yesterday's day's
Collaborated with @niki_poojary
Here's what you'll learn in this thread:
1. Capture Overnight Theta Decay
2. Trading Opening Range Breakouts
3. Reversal Trading Setups
4. Selling strangles and straddles in Bank Nifty
6. NR4 + IB
7. NR 21-Vwap Strategy
Let's dive in ↓
1/ STBT option Selling (Positional Setup):
The setup uses price action to sell options for overnight theta decay.
Check Bank Nifty at 3:15 everyday.
Sell directional credit spreads with capped
A thread about STBT options selling,
— Jig's Patel (@jigspatel1988) July 17, 2021
The purpose is simple to capture overnight theta decay,
Generally, ppl sell ATM straddle with hedge or sell naked options,
But I am using Today\u2019s price action for selling options in STBT,
(1/n)
@jigspatel1988 2/ Selling Strangles in Bank Nifty based on Open Interest Data
Don't trade till 9:45 Am.
Identify the highest OI on puts and calls.
Check combined premium and put a stop on individual
Thread on
— Jig's Patel (@jigspatel1988) July 4, 2021
"Intraday Banknifty Strangle based on OI data"
(System already shared, today just share few examples)
(1/n)
@jigspatel1988 3/ Open Drive (Intraday)
This is an opening range breakout setup with a few conditions.
To be used when the market opens above yesterday's day high
or Below yesterday's day's
#OpenDrive#intradaySetup
— Pathik (@Pathik_Trader) April 16, 2019
Sharing one high probability trending setup for intraday.
Few conditions needs to be met
1. Opening should be above/below previous day high/low for buy/sell setup.
2. Open=low (for buy)
Open=high (for sell)
(1/n)


You May Also Like


1/OK, data mystery time.
This New York Times feature shows China with a Gini Index of less than 30, which would make it more equal than Canada, France, or the Netherlands. https://t.co/g3Sv6DZTDE
That's weird. Income inequality in China is legendary.
Let's check this number.
2/The New York Times cites the World Bank's recent report, "Fair Progress? Economic Mobility across Generations Around the World".
The report is available here:
3/The World Bank report has a graph in which it appears to show the same value for China's Gini - under 0.3.
The graph cites the World Development Indicators as its source for the income inequality data.

4/The World Development Indicators are available at the World Bank's website.
Here's the Gini index: https://t.co/MvylQzpX6A
It looks as if the latest estimate for China's Gini is 42.2.
That estimate is from 2012.
5/A Gini of 42.2 would put China in the same neighborhood as the U.S., whose Gini was estimated at 41 in 2013.
I can't find the <30 number anywhere. The only other estimate in the tables for China is from 2008, when it was estimated at 42.8.
This New York Times feature shows China with a Gini Index of less than 30, which would make it more equal than Canada, France, or the Netherlands. https://t.co/g3Sv6DZTDE
That's weird. Income inequality in China is legendary.
Let's check this number.
2/The New York Times cites the World Bank's recent report, "Fair Progress? Economic Mobility across Generations Around the World".
The report is available here:
3/The World Bank report has a graph in which it appears to show the same value for China's Gini - under 0.3.
The graph cites the World Development Indicators as its source for the income inequality data.
4/The World Development Indicators are available at the World Bank's website.
Here's the Gini index: https://t.co/MvylQzpX6A
It looks as if the latest estimate for China's Gini is 42.2.
That estimate is from 2012.
5/A Gini of 42.2 would put China in the same neighborhood as the U.S., whose Gini was estimated at 41 in 2013.
I can't find the <30 number anywhere. The only other estimate in the tables for China is from 2008, when it was estimated at 42.8.