Unfortunately, they're not available to the public (even Bernstein's client website cuts off at 2003), but happy to give more details if necessary
1/ Lessons From The Tech Bubble:
Last year, I spent my winter holiday reading hundreds of pages of equity research from the 1999/2000 era, to try to understand what it was like investing during the bubble
A few people recently asked me for my takeaways. Here they are -
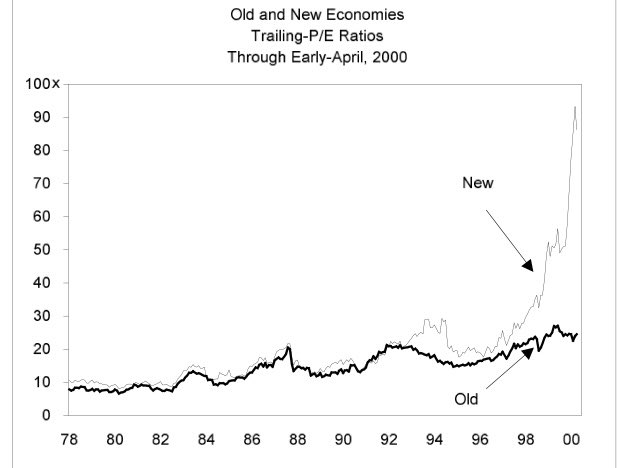
Unfortunately, they're not available to the public (even Bernstein's client website cuts off at 2003), but happy to give more details if necessary
Unfortunately, the quip "it's not a bubble if everyone says it is" just isn't true
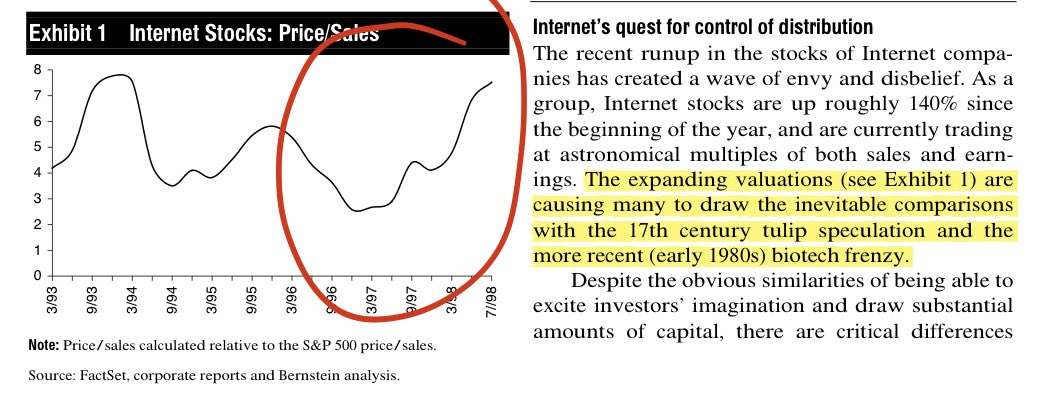
Investors were comparing the internet sector to tulip mania as early as mid-98. Bernstein held an entire conference on it in June 99!
In truth, the hard part about the tech bubble wasn't noticing it. The hard part was timing it
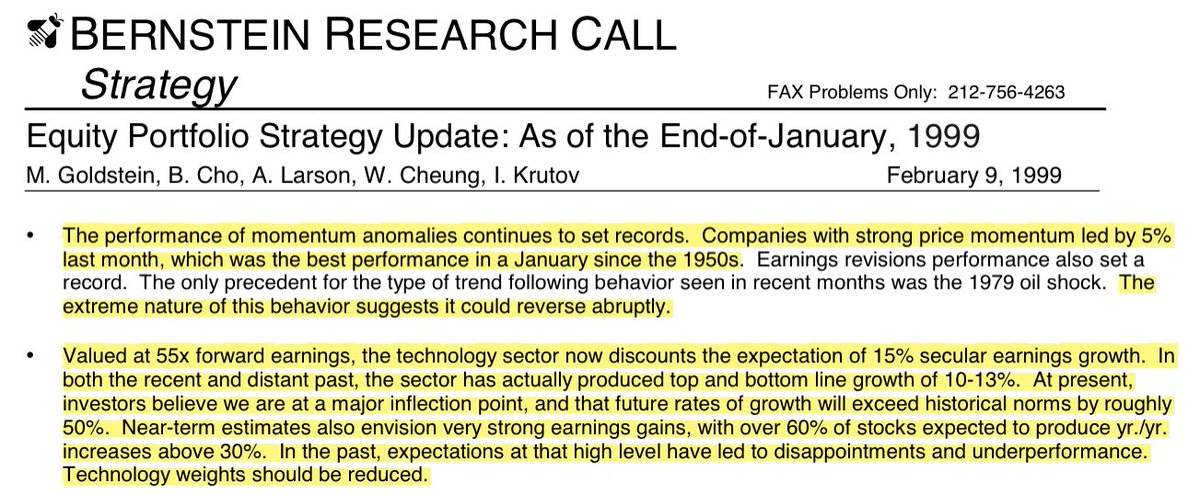
Our equity strategist tried in January 99... he was off by 14 months (and another 30 point gap in value vs growth)
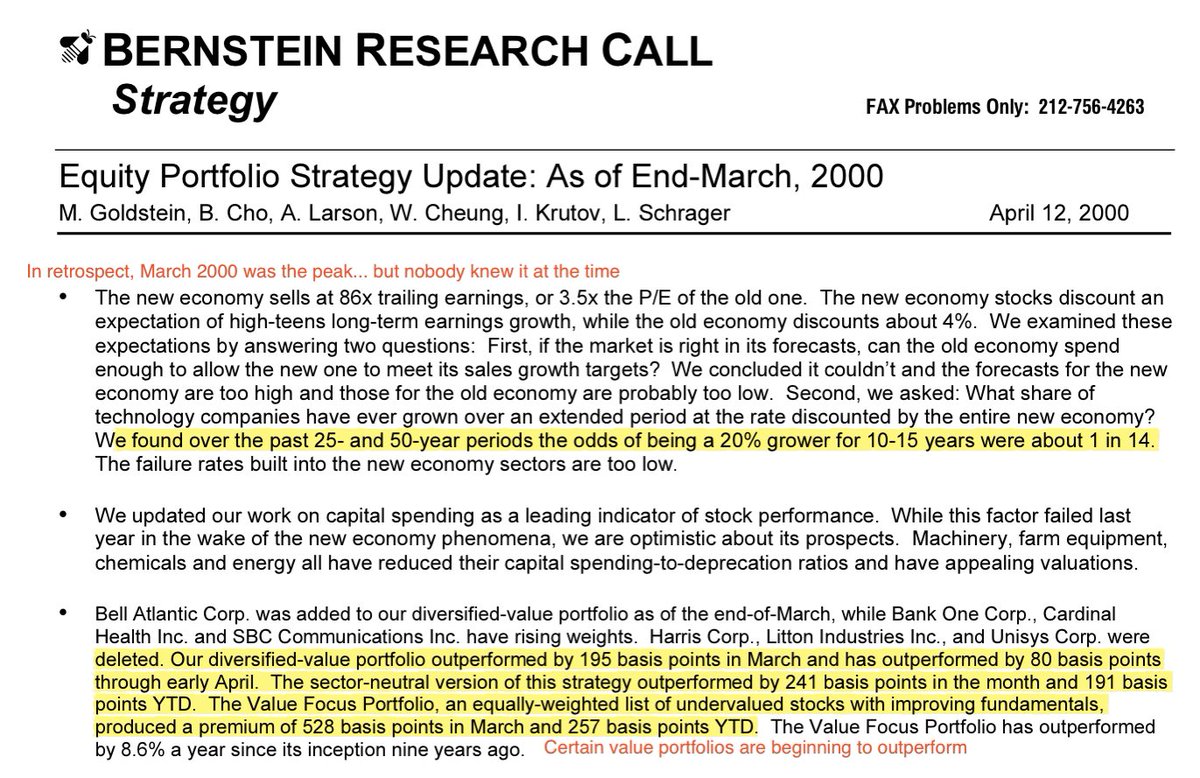
Nobody noticed in March 2000 when it finally popped. Our equity strategist (who bet his career on it!) didn't catch on until June
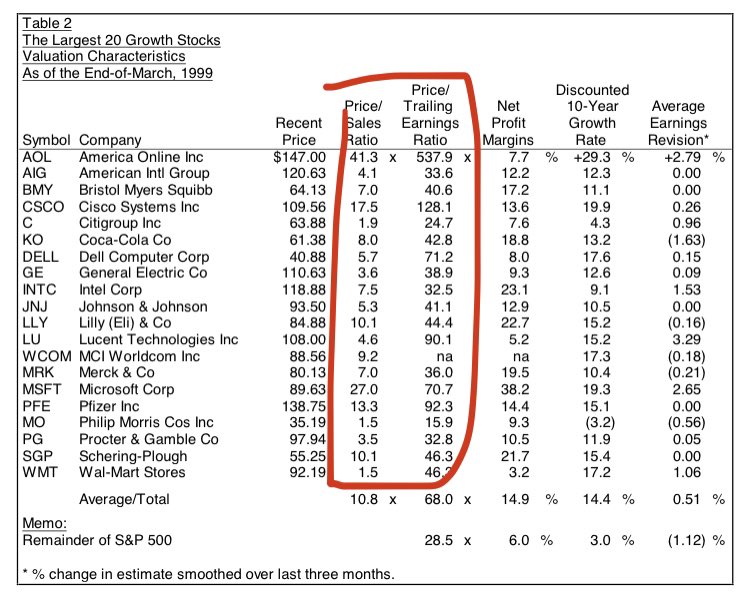
See the valuation table below, 1 year before the top
Yes, Microsoft traded at 70x earnings. But Coca Cola was 43x. Pfizer was 92x. Every stock here was a disaster over the next 10 years...
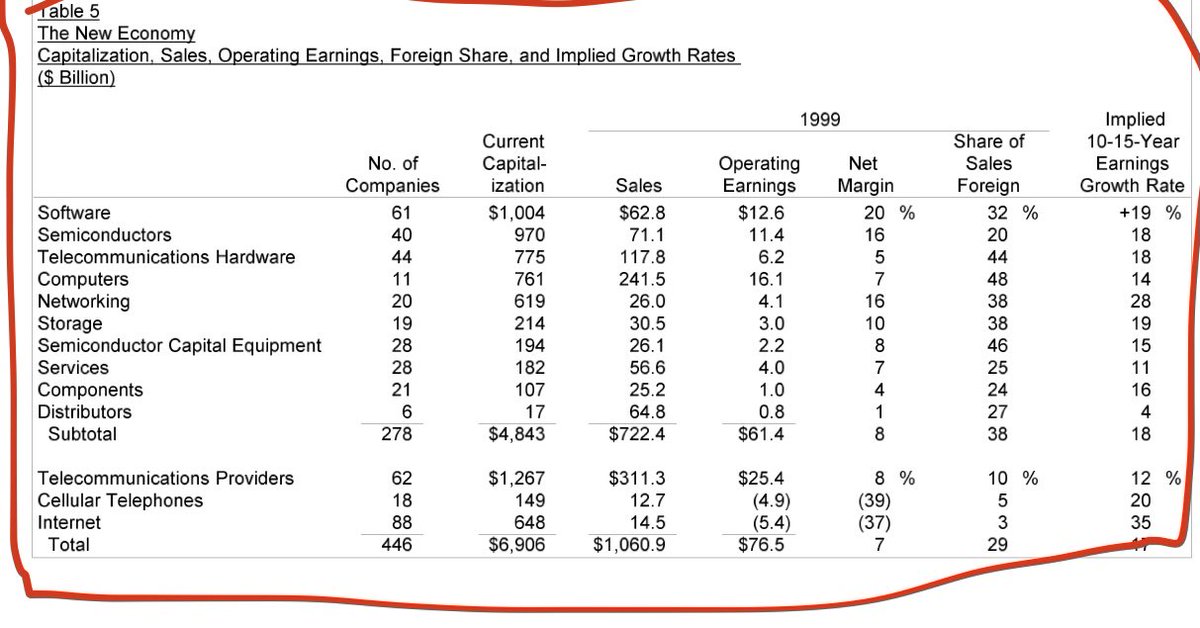
The internet stocks were a sideshow. In 2000, the software sector had a $1 trillion market cap, 20% net margins, 20% annual growth
The problem? It was trading at 16x sales
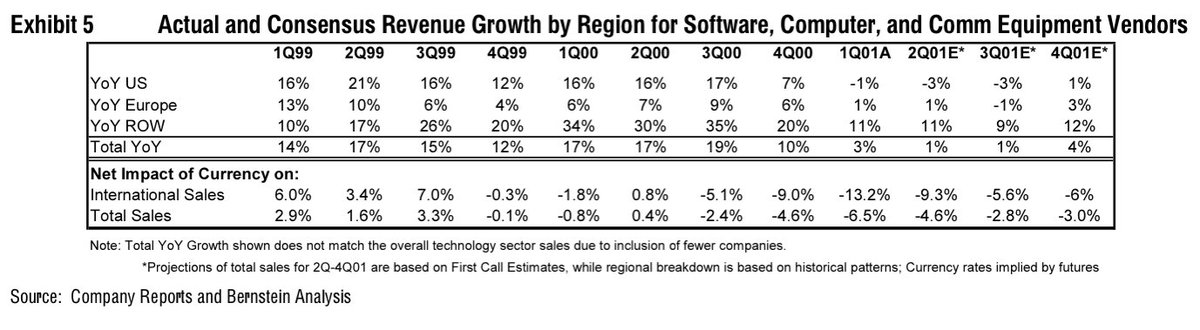
The bubble popped in Q1 2000. Fundamentals didn't decelerate until Q4 2000.
It was reflexivity at work. Lower stock prices = less capex spend = less revenue growth = lower stock prices. A vicious cycle
More from Trading




A thread on getting intraday (any timeframe) data to excel without any coding. Limited to only last 60 days. Fetches from zerodha chart.
👇
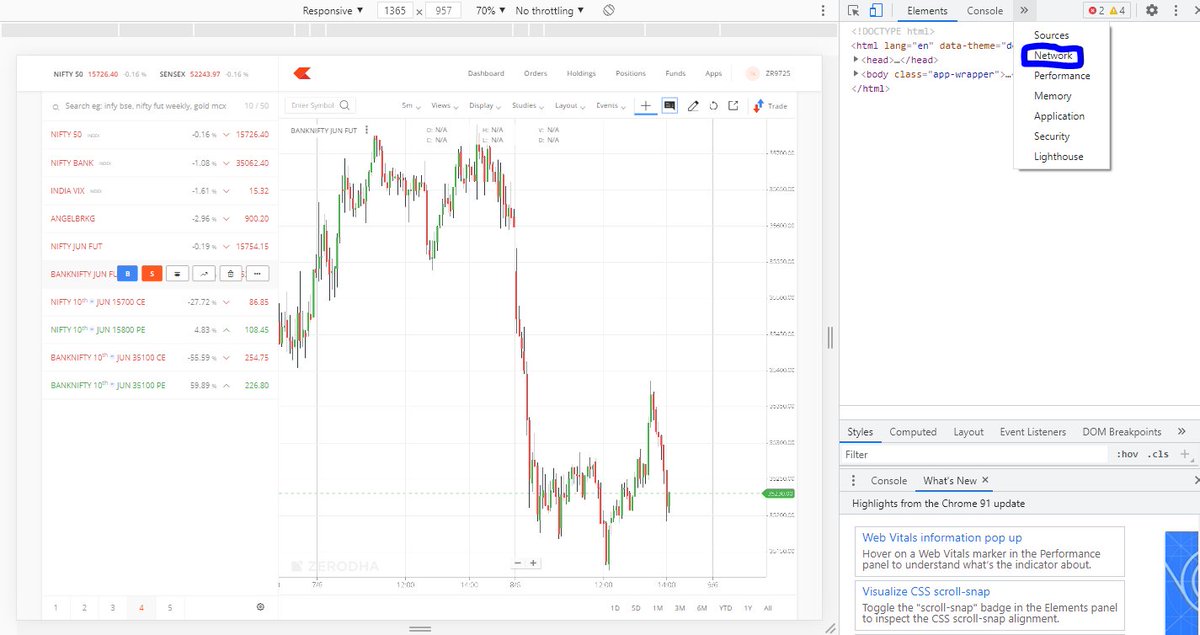
1. Open the chart on zerodha web in chrome. Right click and select 'Inspect'. Click 'Network' as shown in this pic.
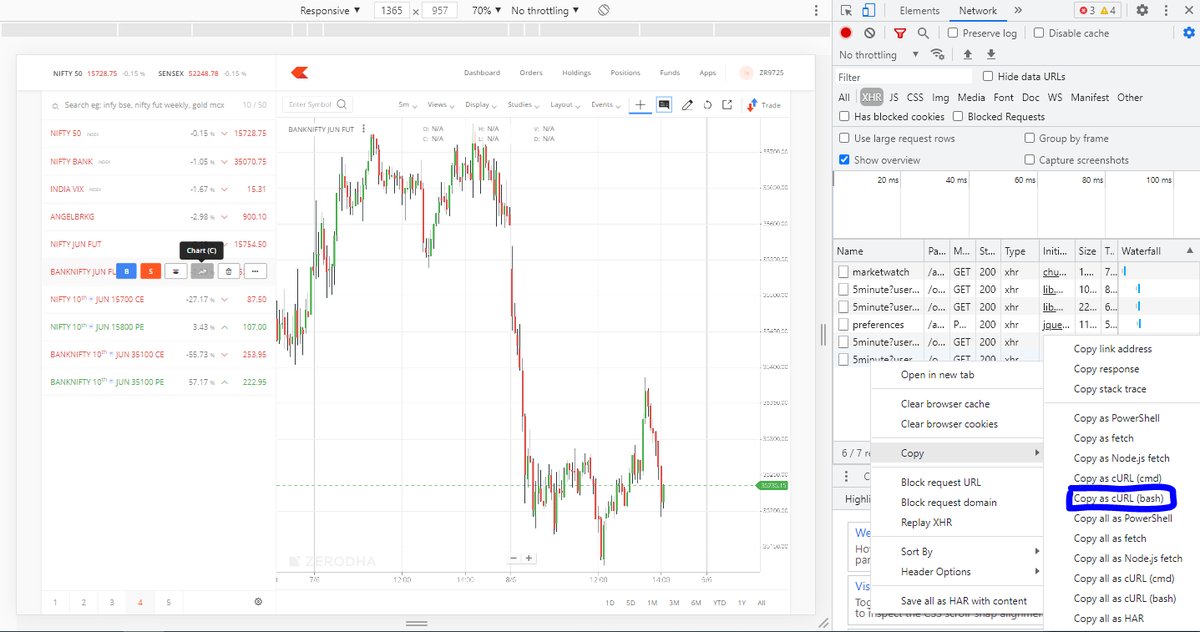
2. Right click on the last entry on the table you see and click 'copy as cURL (bash)'
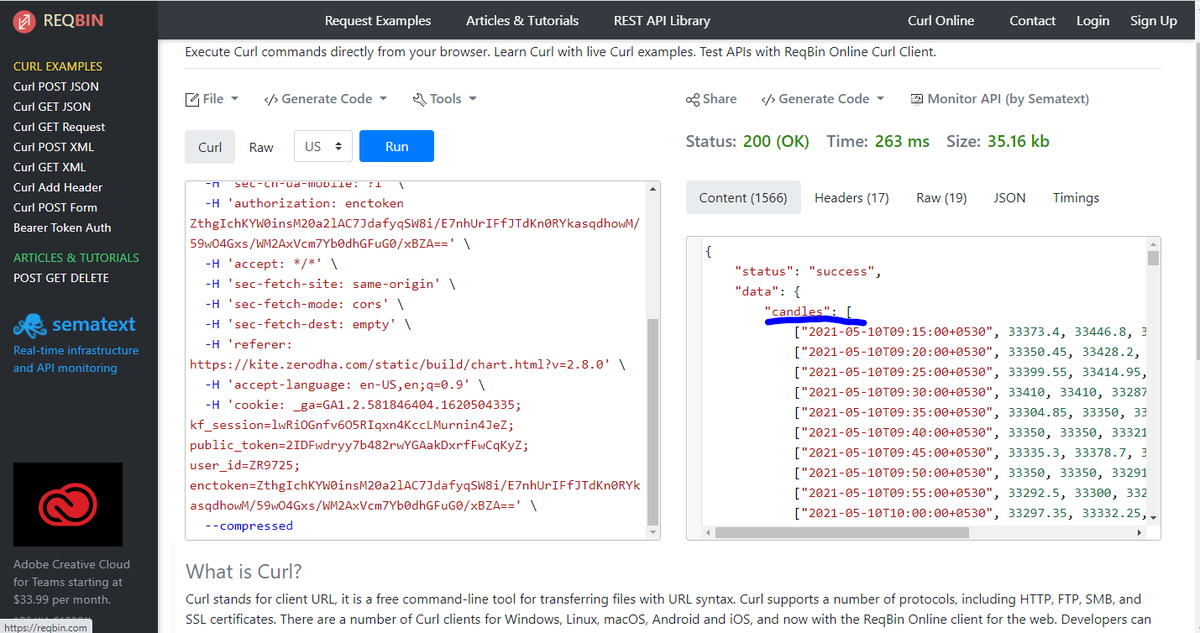
3. Go to website https://t.co/f8rhwoGLUc and paste on the left box and click 'Run'
4. The output below candles written on right of box is the ohlc, volume and oi data. Copy and paste to excel.
👇
1. Open the chart on zerodha web in chrome. Right click and select 'Inspect'. Click 'Network' as shown in this pic.
2. Right click on the last entry on the table you see and click 'copy as cURL (bash)'
3. Go to website https://t.co/f8rhwoGLUc and paste on the left box and click 'Run'
4. The output below candles written on right of box is the ohlc, volume and oi data. Copy and paste to excel.