Charts Time!
Follow the thread
$SPY $SPX $QQQ $JETS $NVDA $AMZN $XLE $XLF $PLTR $IWM $TRAN $MJ

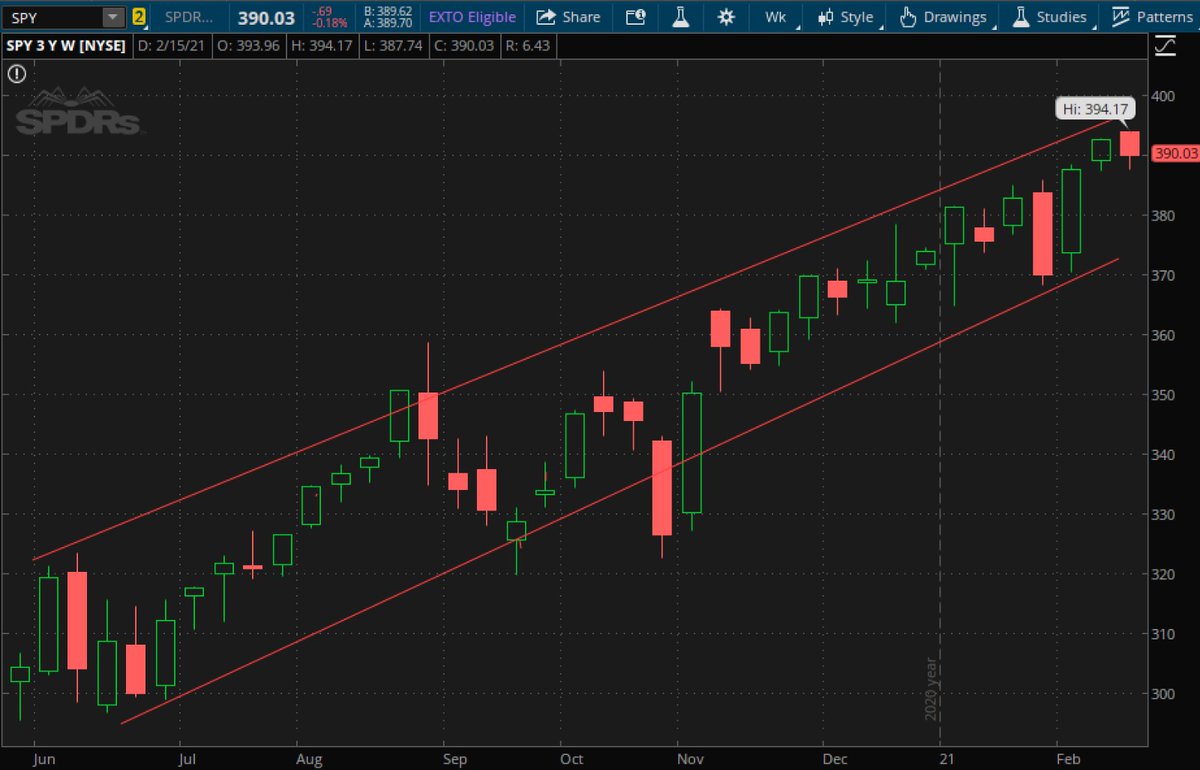
$SPY
still looks very bullish on weekly, i expect it to move to 400 early next week
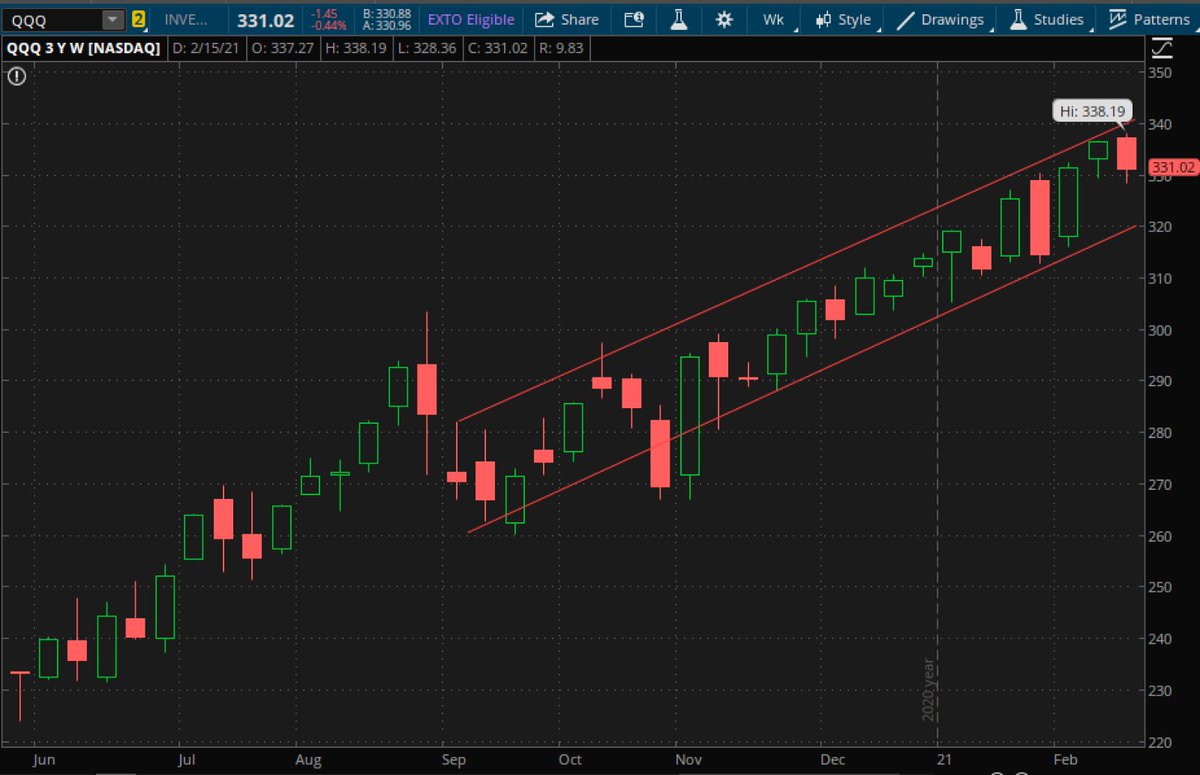
$QQQ
#QQQ similar on weekly, if it dips anywhere close towards 320, buy weeklies and monthlies as its gonna go right back up, below this line though we'll see what happens
$IWM
small caps have absolutely been on fire #IWM since elections, do you think the run continues?
$JETS
#Jets monthly chart - check out the base range it created since 2017 until pandemic, 28-32, looks like its creating a nice long pattern and trying to go back to that range, lets see if it continues and breaks 28 again
$XLE
#XLE back to its last summer high, above this we can see a run towards 55-60
$XLF
Banks index continue to impress, moved above the pre-pandemic highs finally, this is still very bullish and continues to grow
$TRAN
Transports breaking from the current channel, i took some profits yesterday, but looks like it could start something special
$MJ
#MJ needs to hold here
$TSLA
#TSLA holy grail setup falling wedge, can start a new run towards 900+ again
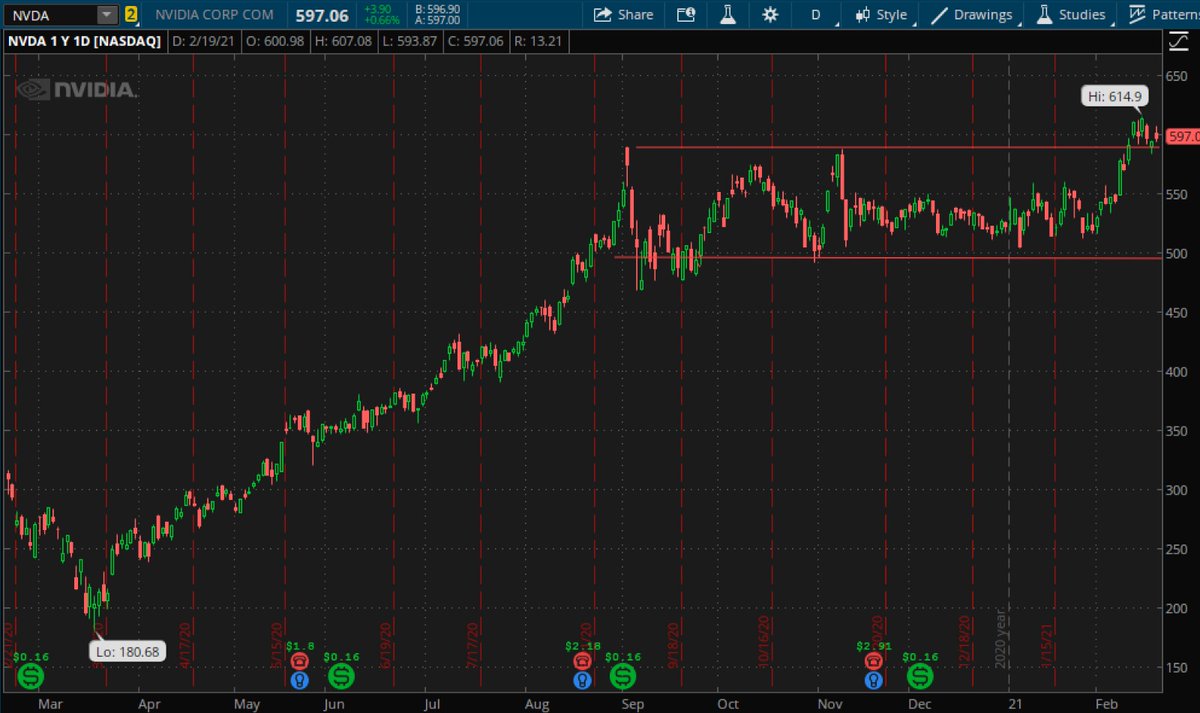
$NVDA
#NVDA needs to stay over the breakout level, below this and i'll get less interested, earnings next week
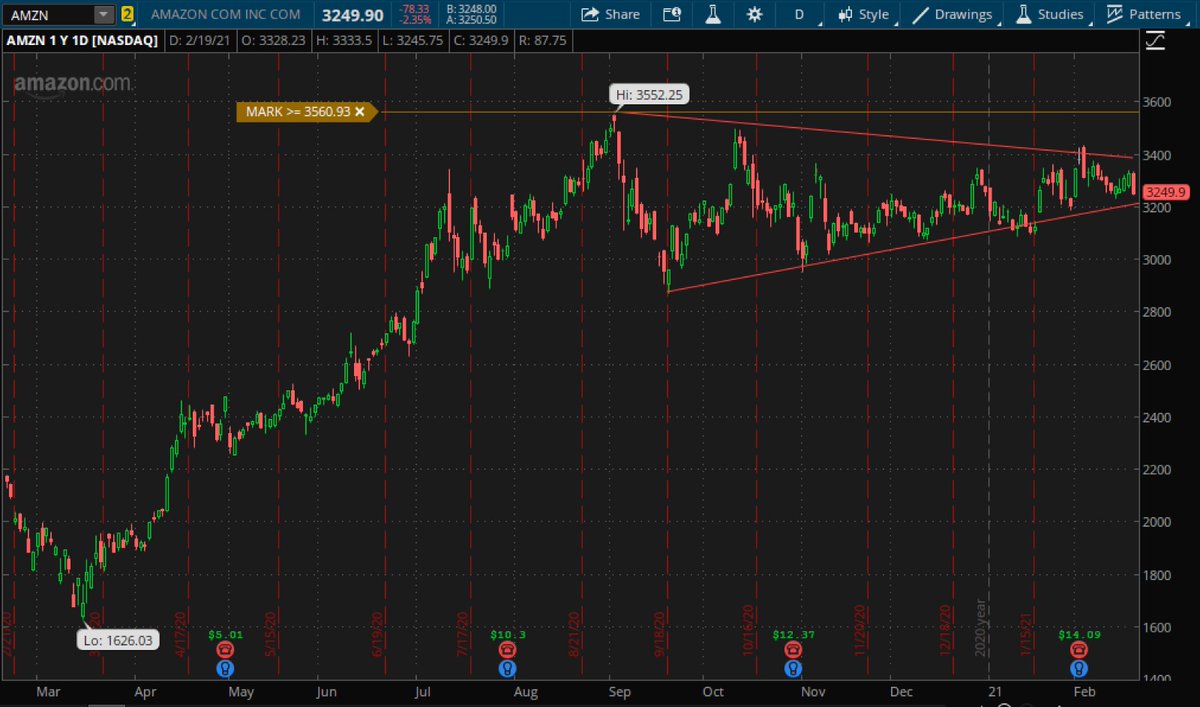
$AMZN
everyone just waiting on amzn to pop from here and it needs to hold this level here, above 3400 we need to see 3489 and 3552, after that we can see a nice run again
$CRM
#CRM disappointment last week, but still inside the channel, look for some continuation next week, earnings next week
$PLTR
#PLTR looks beautiful on the holy grail falling wedge setup, looks like it can test 40 again by march
Thank you for viewing!
Follow and subscribe for weekly charts :)
Have a fantastic weekend

p.s. Stonks only go up!
@threadreaderapp unroll

More from Trading

TradingView isn't just charts

It's much more powerful than you think

9 things TradingView can do, you'll wish you knew yesterday: 🧵

Collaborated with @niki_poojary

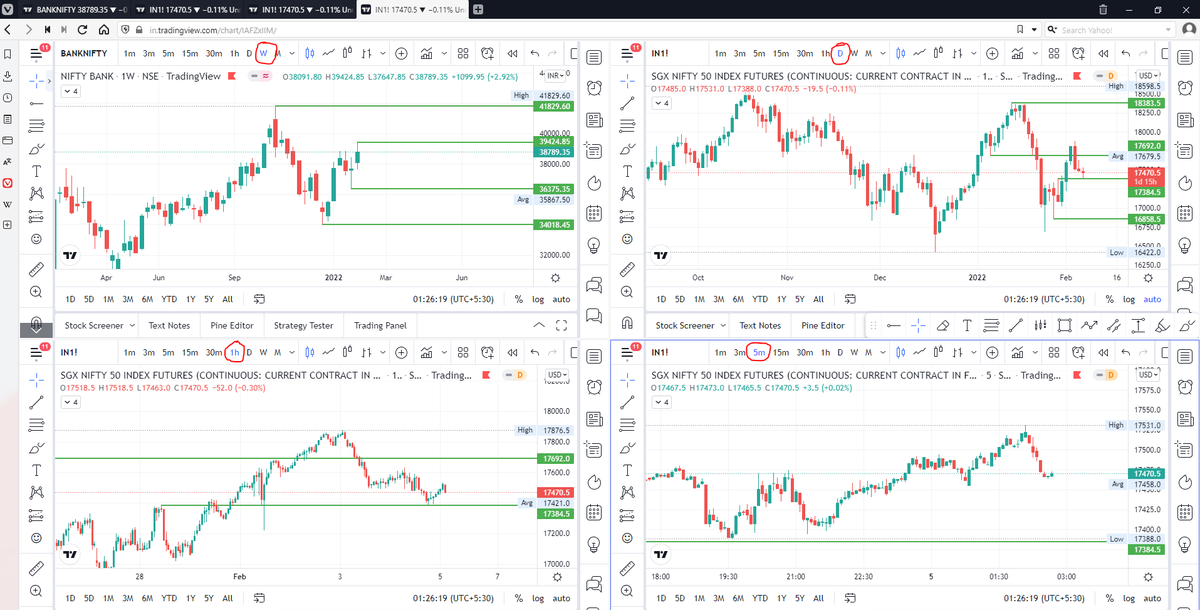
1/ Free Multi Timeframe Analysis

Step 1. Download Vivaldi Browser

Step 2. Login to trading view

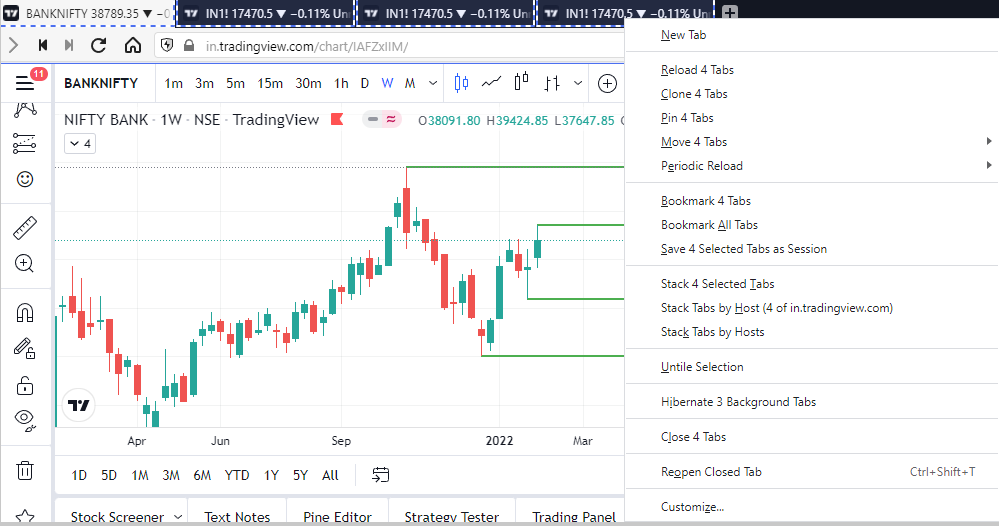
Step 3. Open bank nifty chart in 4 separate windows

Step 4. Click on the first tab and shift + click by mouse on the last tab.

Step 5. Select "Tile all 4 tabs"


What happens is you get 4 charts joint on one screen.

Refer to the attached picture.

The best part about this is this is absolutely free to do.

Also, do note:

I do not have the paid version of trading view.


2/ Free Multiple Watchlists

Go through this informative thread where @sarosijghosh teaches you how to create multiple free watchlists in the free


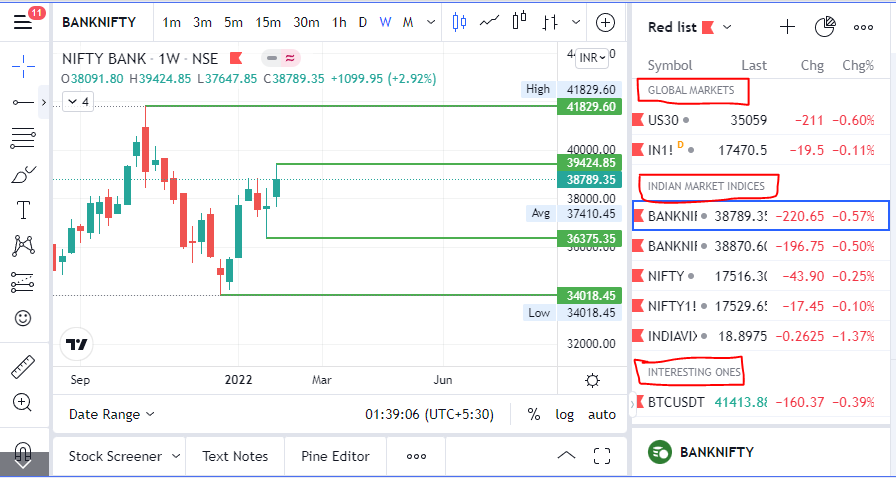
3/ Free Segregation into different headers/sectors

You can create multiple sections sector-wise for free.

1. Long tap on any index/stock and click on "Add section above."
2. Secgregate the stocks/indices based on where they belong.

Kinda like how I did in the picture below.

You May Also Like

So the cryptocurrency industry has basically two products, one which is relatively benign and doesn't have product market fit, and one which is malignant and does. The industry has a weird superposition of understanding this fact and (strategically?) not understanding it.


The benign product is sovereign programmable money, which is historically a niche interest of folks with a relatively clustered set of beliefs about the state, the literary merit of Snow Crash, and the utility of gold to the modern economy.

This product has narrow appeal and, accordingly, is worth about as much as everything else on a 486 sitting in someone's basement is worth.

The other product is investment scams, which have approximately the best product market fit of anything produced by humans. In no age, in no country, in no city, at no level of sophistication do people consistently say "Actually I would prefer not to get money for nothing."

This product needs the exchanges like they need oxygen, because the value of it is directly tied to having payment rails to move real currency into the ecosystem and some jurisdictional and regulatory legerdemain to stay one step ahead of the banhammer.