1/1
Section 1 — Supply and Demand

Basic Trading Principles
Demand = Buyers
Buyers = Support

Supply = Sellers
Sellers = Resistance

Support will be the level at which demand will outweigh supply, causing the price to rise/increase.
1/2

Resistance will be the level at which supply will outweigh demand, causing the price to fall/decrease.
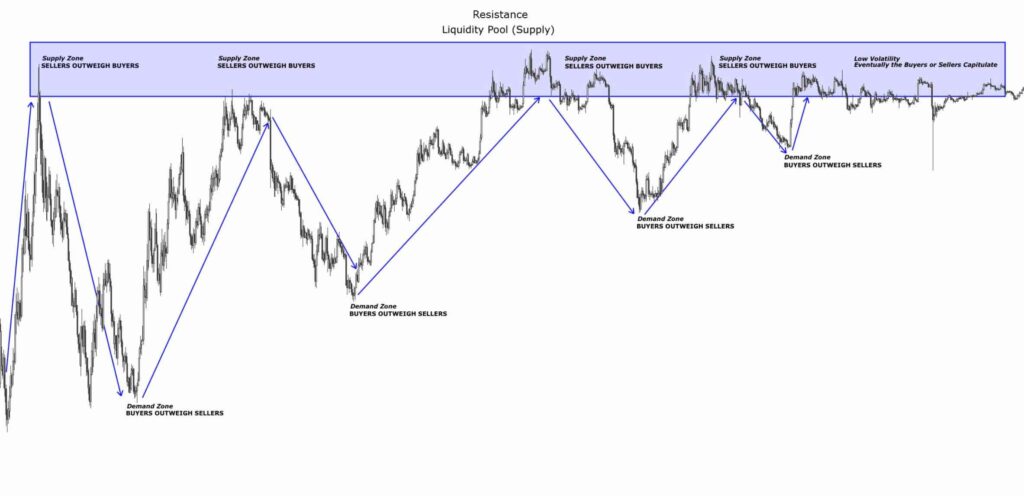
Supply and demand zones in trading are usually liquidity pools.
When an asset illustrates a sharp rise or decline large institutional players (whales in the case of crypto)
1/3
sometimes miss the entry or exit because of the size of the orders. When this happens they leave pending orders to buy or sell at the base of the liquidity zones, with the expectation that the price will return there to fill the remaining orders.
1/4
A high price rise zone is the demand zone (support) and the zone where price has made a sharp decline is the supply zone (resistance).
Demand Zone (Buyers Present)
Technical Analysis Term = Support
1/5
Supply Zone (Sellers Present)
Technical Analysis Term = Resistance

Important to Remember — Both supply and demand
1/6
zones have a finite number of buyers and sellers. The more a zone is touched the weaker it becomes. This is evident because price rebounds and makes lower highs off demand zones (support) and price drops less and less off supply zones (resistance) making higher lows.
1/7
Each time price reaches the supply zone price is knocked down (falls/decreases), but each time buyers step in they are bidding up price creating a higher low than before. This is a bullish price structure and is called an uptrend.
1/8
Each time price reaches the demand zone price is bid up (rises/increases), but each time sellers step in they are pushing price down creating a lower high than before. This is a bearish price structure and is called a downtrend.

More from Trading

TradingView isn't just charts

It's much more powerful than you think

9 things TradingView can do, you'll wish you knew yesterday: 🧵

Collaborated with @niki_poojary

1/ Free Multi Timeframe Analysis

Step 1. Download Vivaldi Browser

Step 2. Login to trading view

Step 3. Open bank nifty chart in 4 separate windows

Step 4. Click on the first tab and shift + click by mouse on the last tab.

Step 5. Select "Tile all 4 tabs"


What happens is you get 4 charts joint on one screen.

Refer to the attached picture.

The best part about this is this is absolutely free to do.

Also, do note:

I do not have the paid version of trading view.


2/ Free Multiple Watchlists

Go through this informative thread where @sarosijghosh teaches you how to create multiple free watchlists in the free


3/ Free Segregation into different headers/sectors

You can create multiple sections sector-wise for free.

1. Long tap on any index/stock and click on "Add section above."
2. Secgregate the stocks/indices based on where they belong.

Kinda like how I did in the picture below.

You May Also Like