I hate to correct @elonmusk, but his assertion that it takes 20 years to replace the vehicle fleet is wrong. This thread tries to describe why. 1/
This will drasticaly decrease the total size of the global car fleet as the rate of cars retirering will be at least twice the size of the cars being retired 4/
This becomes a feedback loop what will both decrease the vehicle fleet and collapse the value of ICE cars. 7/
More from Tech


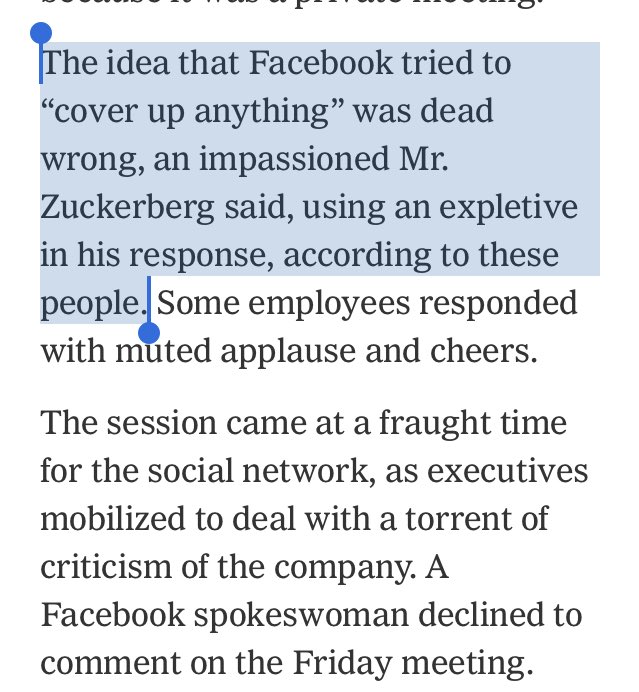
I could create an entire twitter feed of things Facebook has tried to cover up since 2015. Where do you want to start, Mark and Sheryl? https://t.co/1trgupQEH9
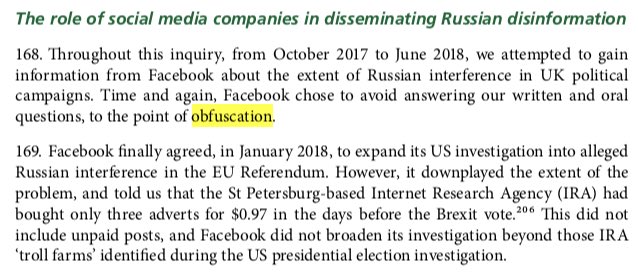
Ok, here. Just one of the 236 mentions of Facebook in the under read but incredibly important interim report from Parliament. ht @CommonsCMS https://t.co/gfhHCrOLeU
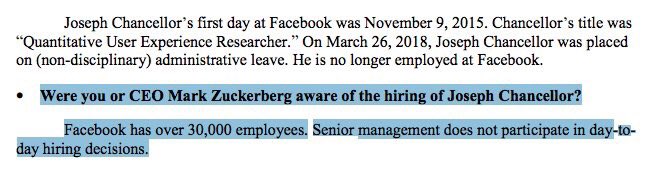
Let’s do another, this one to Senate Intel. Question: “Were you or CEO Mark Zuckerberg aware of the hiring of Joseph Chancellor?"
Answer "Facebook has over 30,000 employees. Senior management does not participate in day-today hiring decisions."
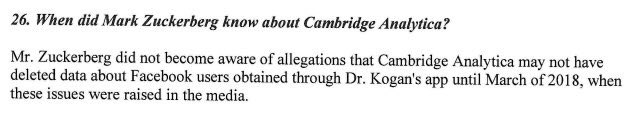
Or to @CommonsCMS: Question: "When did Mark Zuckerberg know about Cambridge Analytica?"
Answer: "He did not become aware of allegations CA may not have deleted data about FB users obtained through Dr. Kogan's app until March of 2018, when
these issues were raised in the media."
If you prefer visuals, watch this short clip after @IanCLucas rightly expresses concern about a Facebook exec failing to disclose info.
Ok, here. Just one of the 236 mentions of Facebook in the under read but incredibly important interim report from Parliament. ht @CommonsCMS https://t.co/gfhHCrOLeU
Let’s do another, this one to Senate Intel. Question: “Were you or CEO Mark Zuckerberg aware of the hiring of Joseph Chancellor?"
Answer "Facebook has over 30,000 employees. Senior management does not participate in day-today hiring decisions."
Or to @CommonsCMS: Question: "When did Mark Zuckerberg know about Cambridge Analytica?"
Answer: "He did not become aware of allegations CA may not have deleted data about FB users obtained through Dr. Kogan's app until March of 2018, when
these issues were raised in the media."
If you prefer visuals, watch this short clip after @IanCLucas rightly expresses concern about a Facebook exec failing to disclose info.
A company as powerful as @facebook should be subject to proper scrutiny. Mike Schroepfer, its CTO, told us that the buck stops with Mark Zuckerberg on the Cambridge Analytica scandal, which is why he should come and answer our questions @DamianCollins @IanCLucas pic.twitter.com/0H4VMhtIFu
— Digital, Culture, Media and Sport Committee (@CommonsCMS) May 23, 2018


So we had to develop technologies like this to barely manage control over limited areas in Iraq's few urban centers. Only ~8 in 100 Iraqi adults owns a personal vehicle. That rate is > 1 car/adult in America yet I have never seen any doctrine paper or work of fiction address this
We've seen and struggled in civil conflicts with instant, local, universal, distributed communications (cell phone era, basically every conflict since 2000). We've seen and struggled in conflicts with instant, global, universal distributed communications (everything since 2011).
The world's most overfunded military and glow in the dark agencies struggle and largely fail to contain conflicts where fhe vast, vast majority of people are locked into a ~5mi radius of their home.
How can they possibly contain a conflict in a nation with universal car ownership and the most developed road network in the world? The average car can travel over 400 miles on one tank of gas, how can you contain the potential of that kind of mobility?
I think that's partially why the system was so freaked out by 1/6. Yes, most of it is histrionics but you don't decide to indefinitely turn your capital into the Baghdad Green Zone with fortifications and 25k troops over histrionics alone.
Hey guys, just a friendly reminder. We're watching you. pic.twitter.com/bGwi1uJBwT
— CIA Metadata Analyst with 8 kids (@CiaKids) September 23, 2019
We've seen and struggled in civil conflicts with instant, local, universal, distributed communications (cell phone era, basically every conflict since 2000). We've seen and struggled in conflicts with instant, global, universal distributed communications (everything since 2011).
The world's most overfunded military and glow in the dark agencies struggle and largely fail to contain conflicts where fhe vast, vast majority of people are locked into a ~5mi radius of their home.
How can they possibly contain a conflict in a nation with universal car ownership and the most developed road network in the world? The average car can travel over 400 miles on one tank of gas, how can you contain the potential of that kind of mobility?
I think that's partially why the system was so freaked out by 1/6. Yes, most of it is histrionics but you don't decide to indefinitely turn your capital into the Baghdad Green Zone with fortifications and 25k troops over histrionics alone.

You May Also Like

Trading view scanner process -
1 - open trading view in your browser and select stock scanner in left corner down side .
2 - touch the percentage% gain change ( and u can see higest gainer of today)
3. Then, start with 6% gainer to 20% gainer and look charts of everyone in daily Timeframe . (For fno selection u can choose 1% to 4% )
4. Then manually select the stocks which are going to give all time high BO or 52 high BO or already given.
5. U can also select those stocks which are going to give range breakout or already given range BO
6 . If in 15 min chart📊 any stock sustaing near BO zone or after BO then select it on your watchlist
7 . Now next day if any stock show momentum u can take trade in it with RM
This looks very easy & simple but,
U will amazed to see it's result if you follow proper risk management.
I did 4x my capital by trading in only momentum stocks.
I will keep sharing such learning thread 🧵 for you 🙏💞🙏
Keep learning / keep sharing 🙏
@AdityaTodmal
1 - open trading view in your browser and select stock scanner in left corner down side .
2 - touch the percentage% gain change ( and u can see higest gainer of today)
Making thread \U0001f9f5 on trading view scanner by which you can select intraday and btst stocks .
— Vikrant (@Trading0secrets) October 22, 2021
In just few hours (Without any watchlist)
Some manual efforts u have to put on it.
Soon going to share the process with u whenever it will be ready .
"How's the josh?"guys \U0001f57a\U0001f3b7\U0001f483
3. Then, start with 6% gainer to 20% gainer and look charts of everyone in daily Timeframe . (For fno selection u can choose 1% to 4% )
4. Then manually select the stocks which are going to give all time high BO or 52 high BO or already given.
5. U can also select those stocks which are going to give range breakout or already given range BO
6 . If in 15 min chart📊 any stock sustaing near BO zone or after BO then select it on your watchlist
7 . Now next day if any stock show momentum u can take trade in it with RM
This looks very easy & simple but,
U will amazed to see it's result if you follow proper risk management.
I did 4x my capital by trading in only momentum stocks.
I will keep sharing such learning thread 🧵 for you 🙏💞🙏
Keep learning / keep sharing 🙏
@AdityaTodmal