CHARTS OF THE WEEK
++++++++++++++++++
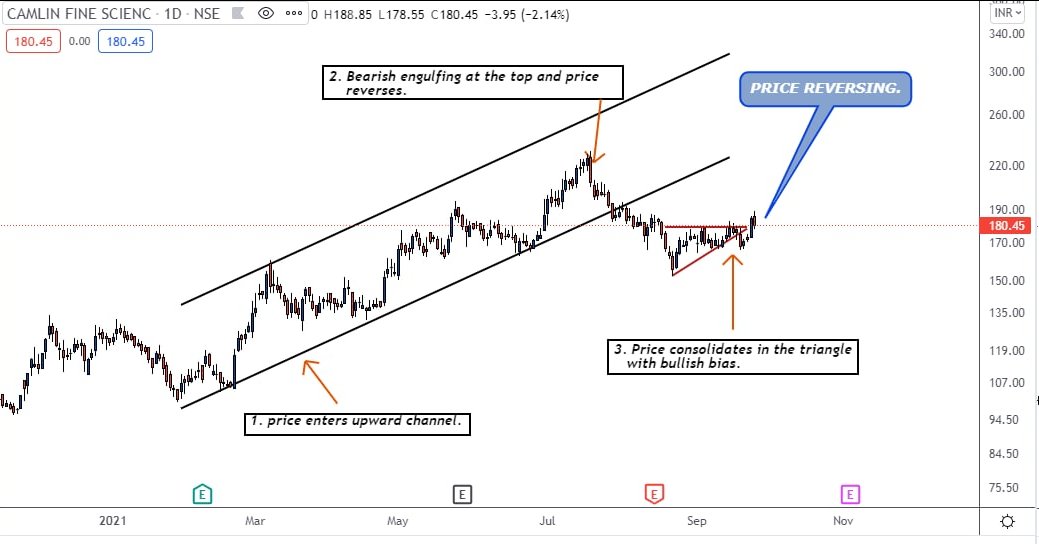
1. CAMLIN FINE SCIENCE : Breaking Out Of Triangle.
2. ONGC : Trading Range Break Out.
3. Manappuram Finance : Trading Range Break.
4. SYNGENE : Cup & Handle Pattern.
#priceNpedia
More from priceNpedia

More from Syngene


#SYNGENE-648
Showing strength..towards 3.618%(778)
#Probability
Showing strength..towards 3.618%(778)
#Probability
#SYNGENE -618
— MaRkET WaVES (DINESH PATEL ) Stock Market FARMER (@idineshptl) August 26, 2021
Sustain rise above 622.15 (2.618%)
Near term objective is to move higher towards 3.618%(778) & 4.618%(935)
Long term perspective base Case 212.#Probability pic.twitter.com/L5z4qUDP73