💥
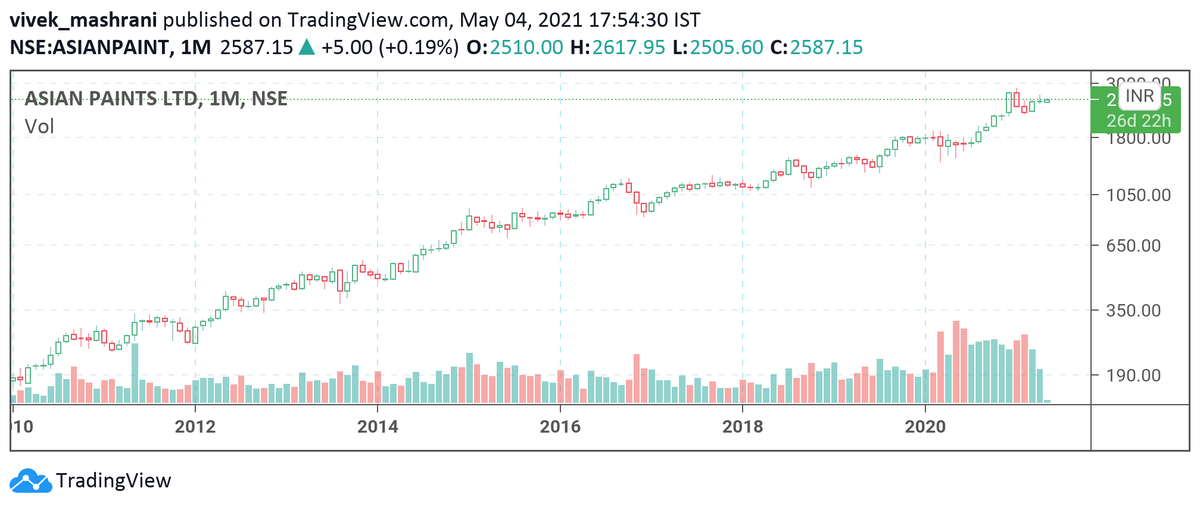
Do you want to check if you are holding earnings compounding machine in less than 3 seconds?
Load 10 years monthly chart...and if it's broadly 45°, most likely you are holding a compunder...
Check for your portfolio companies, now..
Power of #TechnoFunda #investing
🎯🎯
More from Vivek Mashrani, CFA

More from Stockslearnings

#Freetip
Today's move is an example of this tweet. Save this chart for future ref. https://t.co/amUhSLrET3
Today's move is an example of this tweet. Save this chart for future ref. https://t.co/amUhSLrET3
#FreeTip
— HMK alias MANOJ (@scorpiomanojFRM) June 23, 2021
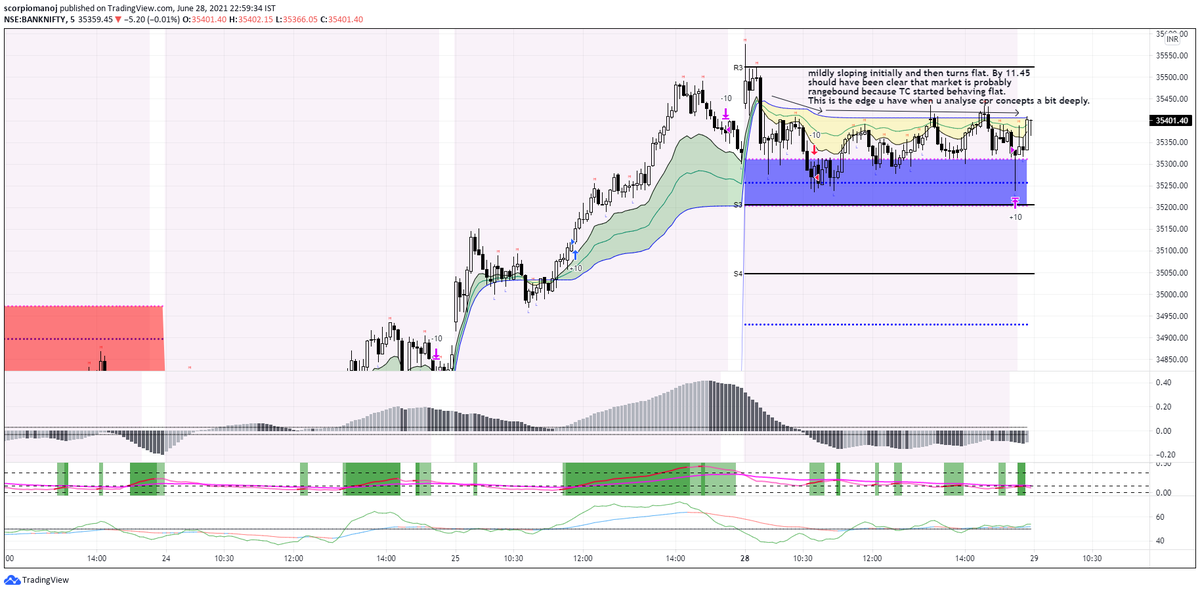
A general rule to assess if a market is ranging is to look at developing TC and / or developing BC. If either of them is flat, it means market is currently ranging. If you are trading in 5 min, go to a lower tf chart, say, 2 min to have a less lagging assessment.


Pls go to Nifty daily chart, convert candle stick chart to line chart
Make time period Weekly
Then click on the encircled + sign in top panel to add different index to compare, u can add any index
Will describe this in our Friday post market session, watch in SE YouTube channel
Make time period Weekly
Then click on the encircled + sign in top panel to add different index to compare, u can add any index
Will describe this in our Friday post market session, watch in SE YouTube channel
Sir can u please make a video on how to get this plotted in trading view .Please sir .a small guidance will be highly appreciated .I know there are many like me who don't know to plot it but are shy to admit .it would benefit them too .thank u sir
— rajesh shetty (@shettyrajeshs) May 4, 2021