

Rectangle pattern also known as trading range, consolidation.We get multi-day, multi-week or multi-month consolidation where price move in range.
Rectangle pattern also known as trading range, consolidation.We get multi-day, multi-week or multi-month consolidation where price move in range.
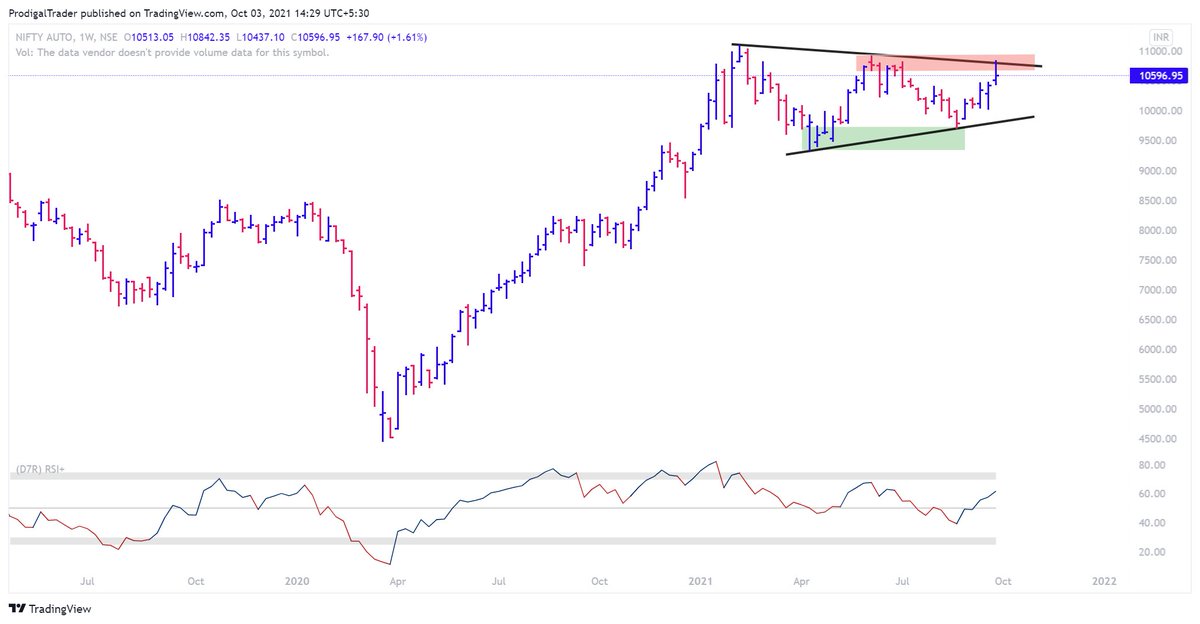
The price should touch two point of resistance and two point of support parallelly to form rectangle pattern. Price move in range line "A " and line "B", line "A" known as resistance or supply, line "B" known as support or demand.

If you go through textbook method volume should dry up during the consolidation. But in my experience it is not necessary that volume should dry up there are time when volume get aggressive during consolidation.


Longer the duration of rectangle pattern generally more aggressive the breakout going to be.
ENTRY:- Entry will be at breakout candle high with 0.3% buffer.

More from Stockslearnings


You May Also Like

#ஆதித்தியஹ்ருதயம் ஸ்தோத்திரம்
இது சூரிய குலத்தில் உதித்த இராமபிரானுக்கு தமிழ் முனிவர் அகத்தியர் உபதேசித்ததாக வால்மீகி இராமாயணத்தில் வருகிறது. ஆதித்ய ஹ்ருதயத்தைத் தினமும் ஓதினால் பெரும் பயன் பெறலாம் என மகான்களும் ஞானிகளும் காலம் காலமாகக் கூறி வருகின்றனர். ராம-ராவண யுத்தத்தை
தேவர்களுடன் சேர்ந்து பார்க்க வந்திருந்த அகத்தியர், அப்போது போரினால் களைத்து, கவலையுடன் காணப்பட்ட ராமபிரானை அணுகி, மனிதர்களிலேயே சிறந்தவனான ராமா போரில் எந்த மந்திரத்தைப் பாராயணம் செய்தால் எல்லா பகைவர்களையும் வெல்ல முடியுமோ அந்த ரகசிய மந்திரத்தை, வேதத்தில் சொல்லப்பட்டுள்ளதை உனக்கு
நான் உபதேசிக்கிறேன், கேள் என்று கூறி உபதேசித்தார். முதல் இரு சுலோகங்கள் சூழ்நிலையை விவரிக்கின்றன. மூன்றாவது சுலோகம் அகத்தியர் இராமபிரானை விளித்துக் கூறுவதாக அமைந்திருக்கிறது. நான்காவது சுலோகம் முதல் முப்பதாம் சுலோகம் வரை ஆதித்ய ஹ்ருதயம் என்னும் நூல். முப்பத்தி ஒன்றாம் சுலோகம்
இந்தத் துதியால் மகிழ்ந்த சூரியன் இராமனை வாழ்த்துவதைக் கூறுவதாக அமைந்திருக்கிறது.
ஐந்தாவது ஸ்லோகம்:
ஸர்வ மங்கள் மாங்கல்யம் ஸர்வ பாப ப்ரநாசனம்
சிந்தா சோக ப்ரசமனம் ஆயுர் வர்த்தனம் உத்தமம்
பொருள்: இந்த அதித்ய ஹ்ருதயம் என்ற துதி மங்களங்களில் சிறந்தது, பாவங்களையும் கவலைகளையும்
குழப்பங்களையும் நீக்குவது, வாழ்நாளை நீட்டிப்பது, மிகவும் சிறந்தது. இதயத்தில் வசிக்கும் பகவானுடைய அனுக்ரகத்தை அளிப்பதாகும்.
முழு ஸ்லோக லிங்க் பொருளுடன் இங்கே உள்ளது https://t.co/Q3qm1TfPmk
சூரியன் உலக இயக்கத்திற்கு மிக முக்கியமானவர். சூரிய சக்தியால்தான் ஜீவராசிகள், பயிர்கள்


I hate when I learn something new (to me) & stunning about the Jeff Epstein network (h/t MoodyKnowsNada.)
Where to begin?
So our new Secretary of State Anthony Blinken's stepfather, Samuel Pisar, was "longtime lawyer and confidant of...Robert Maxwell," Ghislaine Maxwell's Dad.
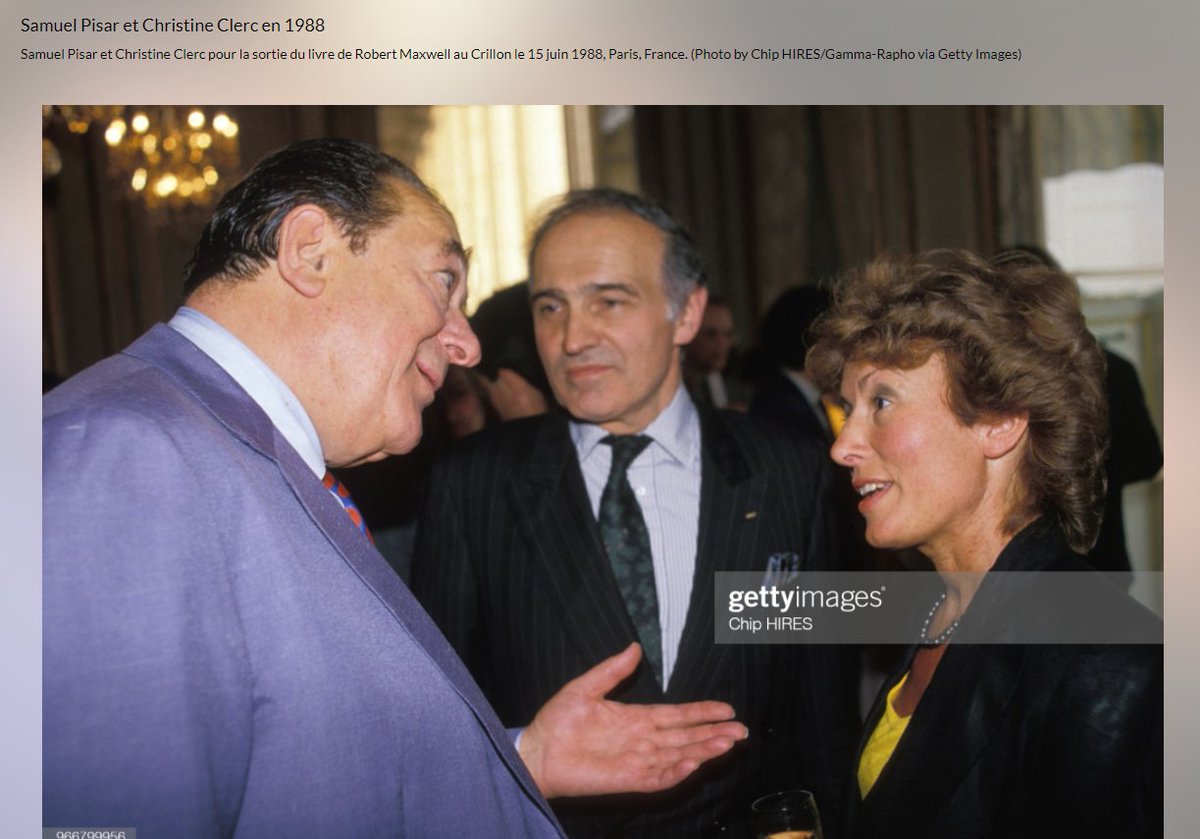
"Pisar was one of the last people to speak to Maxwell, by phone, probably an hour before the chairman of Mirror Group Newspapers fell off his luxury yacht the Lady Ghislaine on 5 November, 1991." https://t.co/DAEgchNyTP

OK, so that's just a coincidence. Moving on, Anthony Blinken "attended the prestigious Dalton School in New York City"...wait, what? https://t.co/DnE6AvHmJg
Dalton School...Dalton School...rings a
Oh that's right.
The dad of the U.S. Attorney General under both George W. Bush & Donald Trump, William Barr, was headmaster of the Dalton School.
Donald Barr was also quite a
I'm not going to even mention that Blinken's stepdad Sam Pisar's name was in Epstein's "black book."
Lots of names in that book. I mean, for example, Cuomo, Trump, Clinton, Prince Andrew, Bill Cosby, Woody Allen - all in that book, and their reputations are spotless.
Where to begin?
So our new Secretary of State Anthony Blinken's stepfather, Samuel Pisar, was "longtime lawyer and confidant of...Robert Maxwell," Ghislaine Maxwell's Dad.
"Pisar was one of the last people to speak to Maxwell, by phone, probably an hour before the chairman of Mirror Group Newspapers fell off his luxury yacht the Lady Ghislaine on 5 November, 1991." https://t.co/DAEgchNyTP
OK, so that's just a coincidence. Moving on, Anthony Blinken "attended the prestigious Dalton School in New York City"...wait, what? https://t.co/DnE6AvHmJg
Dalton School...Dalton School...rings a
Oh that's right.
The dad of the U.S. Attorney General under both George W. Bush & Donald Trump, William Barr, was headmaster of the Dalton School.
Donald Barr was also quite a
Donald Barr had a way with words. pic.twitter.com/JdRBwXPhJn
— Rudy Havenstein, listening to Nas all day. (@RudyHavenstein) September 17, 2020
I'm not going to even mention that Blinken's stepdad Sam Pisar's name was in Epstein's "black book."
Lots of names in that book. I mean, for example, Cuomo, Trump, Clinton, Prince Andrew, Bill Cosby, Woody Allen - all in that book, and their reputations are spotless.

1/ 👋 Excited to share what we’ve been building at https://t.co/GOQJ7LjQ2t + we are going to tweetstorm our progress every week!
Week 1 highlights: getting shortlisted for YC W2019🤞, acquiring a premium domain💰, meeting Substack's @hamishmckenzie and Stripe CEO @patrickc 🤩
2/ So what is Brew?
brew / bru : / to make (beer, coffee etc.) / verb: begin to develop 🌱
A place for you to enjoy premium content while supporting your favorite creators. Sort of like a ‘Consumer-facing Patreon’ cc @jackconte
(we’re still working on the pitch)
3/ So, why be so transparent? Two words: launch strategy.
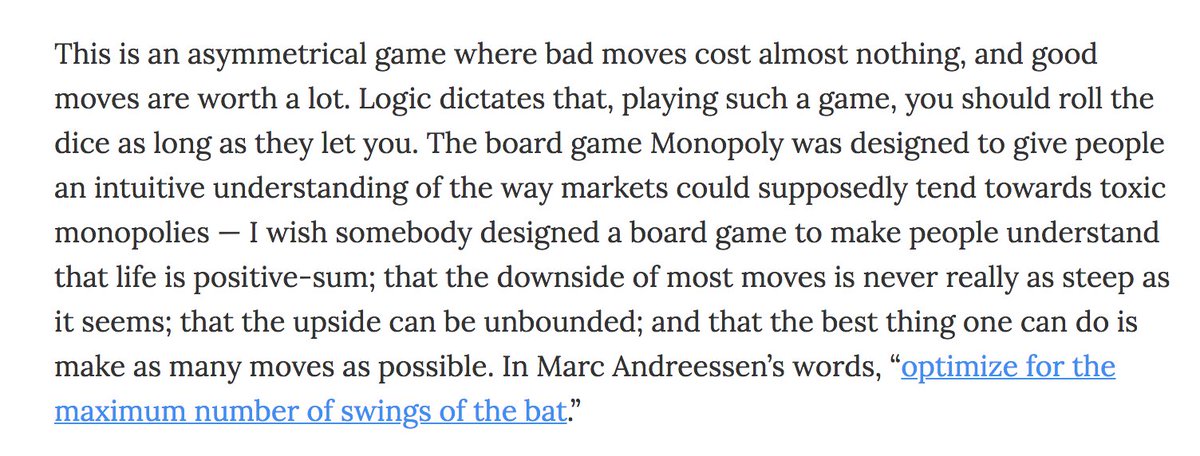
jk 😅 a) I loooove doing something consistently for a long period of time b) limited downside and infinite upside (feedback, accountability, reach).
cc @altimor, @pmarca
4/ https://t.co/GOQJ7LjQ2t domain 🍻
It started with a cold email. Guess what? He was using BuyMeACoffee on his blog, and was excited to hear about what we're building next. Within 2w, we signed the deal at @Escrowcom's SF office. You’re a pleasure to work with @MichaelCyger!
5/ @ycombinator's invite for the in-person interview arrived that evening. Quite a day!
Thanks @patio11 for the thoughtful feedback on our YC application, and @gabhubert for your directions on positioning the product — set the tone for our pitch!
Week 1 highlights: getting shortlisted for YC W2019🤞, acquiring a premium domain💰, meeting Substack's @hamishmckenzie and Stripe CEO @patrickc 🤩
2/ So what is Brew?
brew / bru : / to make (beer, coffee etc.) / verb: begin to develop 🌱
A place for you to enjoy premium content while supporting your favorite creators. Sort of like a ‘Consumer-facing Patreon’ cc @jackconte
(we’re still working on the pitch)
3/ So, why be so transparent? Two words: launch strategy.
jk 😅 a) I loooove doing something consistently for a long period of time b) limited downside and infinite upside (feedback, accountability, reach).
cc @altimor, @pmarca
4/ https://t.co/GOQJ7LjQ2t domain 🍻
It started with a cold email. Guess what? He was using BuyMeACoffee on his blog, and was excited to hear about what we're building next. Within 2w, we signed the deal at @Escrowcom's SF office. You’re a pleasure to work with @MichaelCyger!
5/ @ycombinator's invite for the in-person interview arrived that evening. Quite a day!
Thanks @patio11 for the thoughtful feedback on our YC application, and @gabhubert for your directions on positioning the product — set the tone for our pitch!