1/ In early 2004 we were heads down executing on Edit and Continue across a large contingent of teams. There had been several iterations of scoping, redesigns, and customer feedback.
More from Software
How Silicon Valley, in a Show of Monopolistic Force, Destroyed
In the last three months, tech giants have censored political speech and journalism to manipulate U.S. politics -- banning reporting on the Bidens, removing the President, destroying a new competitor -- while US liberals, with virtual unanimity, have cheered.
The ACLU said the unity of Silicon Valley monopoly power to destroy Parler was deeply troubling. Leaders from Germany, France and Mexico protested. Only US liberals support it, because the dominant strain of US liberalism is not economic socialism but political authoritarianism.
https://t.co/qD9OdwlPbV
Just three months ago, a Dem-led House Committee issued a major report warning of the dangers of the anti-trust power of Apple, Amazon, Google and Facebook. Left-wing scholars have been sounding the alarm for years. Now it's here, and liberals
In the last three months, tech giants have censored political speech and journalism to manipulate U.S. politics -- banning reporting on the Bidens, removing the President, destroying a new competitor -- while US liberals, with virtual unanimity, have cheered.
The ACLU said the unity of Silicon Valley monopoly power to destroy Parler was deeply troubling. Leaders from Germany, France and Mexico protested. Only US liberals support it, because the dominant strain of US liberalism is not economic socialism but political authoritarianism.
https://t.co/qD9OdwlPbV
Just three months ago, a Dem-led House Committee issued a major report warning of the dangers of the anti-trust power of Apple, Amazon, Google and Facebook. Left-wing scholars have been sounding the alarm for years. Now it's here, and liberals
We wrote a 200 page report on why corporate concentration - including the big tech radicalization engines - worsened under both Democratic and Republican administrations. It has to do with antitrust enforcement, and it's fixable by Biden. https://t.co/K85Kv34t83
— Matt Stoller (@matthewstoller) January 12, 2021
🚨 🦮 Seven ways to test for accessibility using only what is already in browser developer tools of Chromium browsers https://t.co/C7kdbigHGE
@MSEdgeDev @EdgeDevTools @ChromiumDev
#tools #accessibility #browsers
Also, a thread: 👇🏼

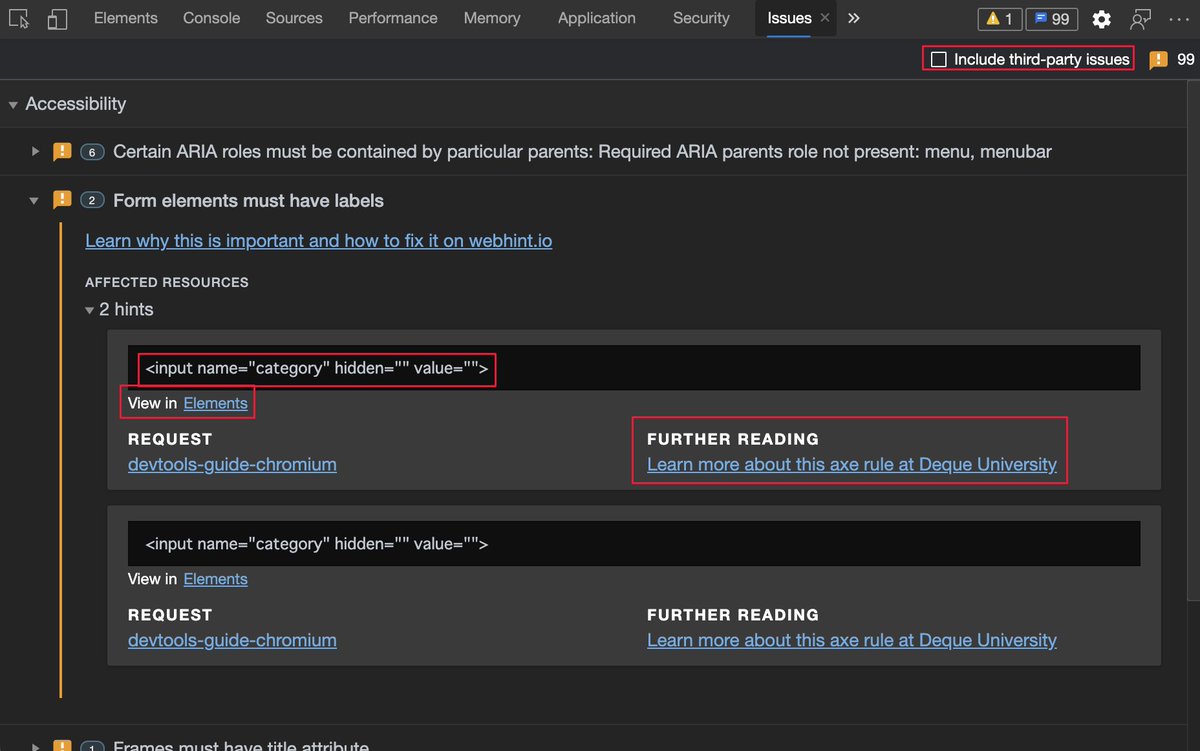
Issues pane, powered by @webhintio, listing accessibility issues with explanations why these are problems, links to more info and direct links to the tools where to fix the problem. https://t.co/4K5RynHhbg
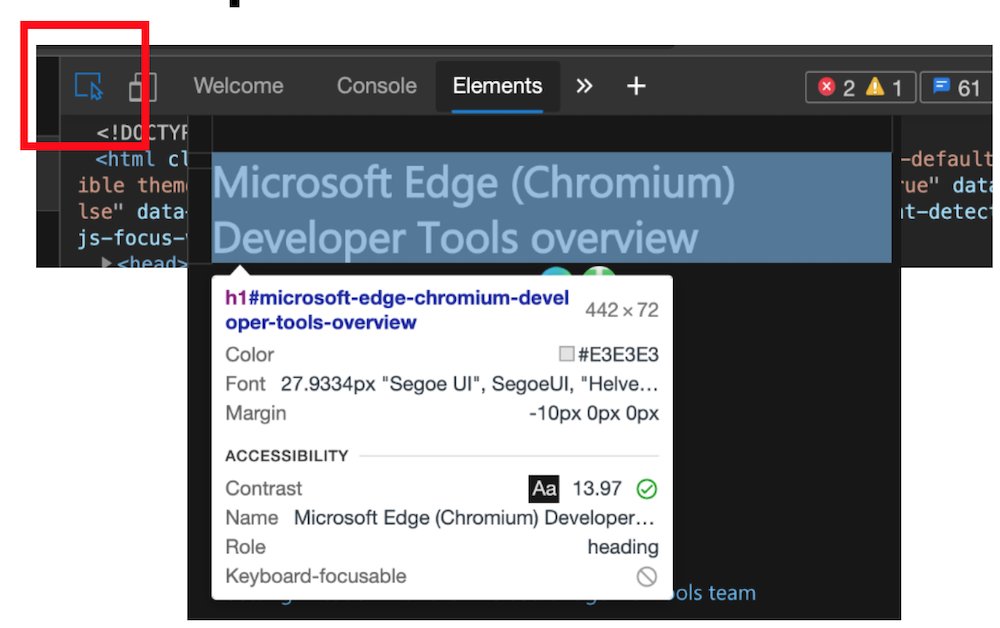
The inspect element overlay showing accessibility relevant information of the element, including contrast information, ARIA name, role and if it can be focused via keyboard.
Colour picker with contrast information offering colours that are AA/AAA compliant. You can also see compliant colours indicated by a line on the colour patch.
Note: the current algorithm fails to take font weight into consideration, that's why there will be a new one.
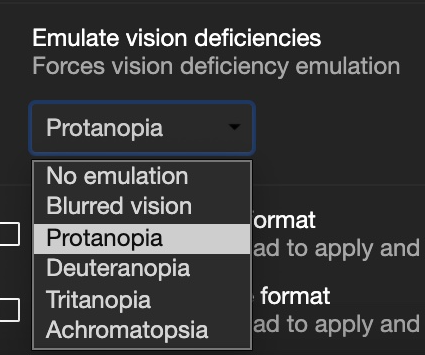
Vision deficit ("colour blindness") emulation. You can see what your product looks like for different visitors.
https://t.co/bxj1vySCAb
@MSEdgeDev @EdgeDevTools @ChromiumDev
#tools #accessibility #browsers
Also, a thread: 👇🏼
Issues pane, powered by @webhintio, listing accessibility issues with explanations why these are problems, links to more info and direct links to the tools where to fix the problem. https://t.co/4K5RynHhbg
The inspect element overlay showing accessibility relevant information of the element, including contrast information, ARIA name, role and if it can be focused via keyboard.
Colour picker with contrast information offering colours that are AA/AAA compliant. You can also see compliant colours indicated by a line on the colour patch.
Note: the current algorithm fails to take font weight into consideration, that's why there will be a new one.
Vision deficit ("colour blindness") emulation. You can see what your product looks like for different visitors.
https://t.co/bxj1vySCAb
Developer productivity, y'all. It is a three TRILLION dollar opportunity, per the stripe report.
Eng managers and directors, we have got to stop asking for "more headcount" and start treating this like the systems problem that it is. https://t.co/XJ0CkFdgiO
If you are getting barely more than 50% productivity out of your very expensive engineers, I can pretty much guarantee you cannot hire your way out of this resourcing issue. 😐
(the stripe report is here:
Say you've got a strategic initiative that 3 engineers to build and support it. Well, they're going to be swimming in the same muddy pipeline as everyone else at ~50%, so you're actually gotta source, hire and train 6, er make that 7 (gonna need another manager too now)...
...which actually understates the problem, because each person you add also adds friction and overhead to the system. Communication, coordination all get harder and processes get more complex and elaborate, etc.
So we could hire 7 people, or we could patch up our sociotechnical system to lose say only 25% productivity to tech debt, instead of 42%? 🤔
By my calculations, that would reclaim 3 engineers worth of capacity given a team of just 17-18 people.
Eng managers and directors, we have got to stop asking for "more headcount" and start treating this like the systems problem that it is. https://t.co/XJ0CkFdgiO
When people often have to spend weeks just to get a local development environment up, there is a lot to improve. \U0001f641
— Daniel Schildt (@autiomaa) December 20, 2020
If you are getting barely more than 50% productivity out of your very expensive engineers, I can pretty much guarantee you cannot hire your way out of this resourcing issue. 😐
(the stripe report is here:
Say you've got a strategic initiative that 3 engineers to build and support it. Well, they're going to be swimming in the same muddy pipeline as everyone else at ~50%, so you're actually gotta source, hire and train 6, er make that 7 (gonna need another manager too now)...
...which actually understates the problem, because each person you add also adds friction and overhead to the system. Communication, coordination all get harder and processes get more complex and elaborate, etc.
So we could hire 7 people, or we could patch up our sociotechnical system to lose say only 25% productivity to tech debt, instead of 42%? 🤔
By my calculations, that would reclaim 3 engineers worth of capacity given a team of just 17-18 people.
You May Also Like
1/OK, data mystery time.
This New York Times feature shows China with a Gini Index of less than 30, which would make it more equal than Canada, France, or the Netherlands. https://t.co/g3Sv6DZTDE
That's weird. Income inequality in China is legendary.
Let's check this number.
2/The New York Times cites the World Bank's recent report, "Fair Progress? Economic Mobility across Generations Around the World".
The report is available here:
3/The World Bank report has a graph in which it appears to show the same value for China's Gini - under 0.3.
The graph cites the World Development Indicators as its source for the income inequality data.
4/The World Development Indicators are available at the World Bank's website.
Here's the Gini index: https://t.co/MvylQzpX6A
It looks as if the latest estimate for China's Gini is 42.2.
That estimate is from 2012.
5/A Gini of 42.2 would put China in the same neighborhood as the U.S., whose Gini was estimated at 41 in 2013.
I can't find the <30 number anywhere. The only other estimate in the tables for China is from 2008, when it was estimated at 42.8.
This New York Times feature shows China with a Gini Index of less than 30, which would make it more equal than Canada, France, or the Netherlands. https://t.co/g3Sv6DZTDE
That's weird. Income inequality in China is legendary.
Let's check this number.
2/The New York Times cites the World Bank's recent report, "Fair Progress? Economic Mobility across Generations Around the World".
The report is available here:
3/The World Bank report has a graph in which it appears to show the same value for China's Gini - under 0.3.
The graph cites the World Development Indicators as its source for the income inequality data.
4/The World Development Indicators are available at the World Bank's website.
Here's the Gini index: https://t.co/MvylQzpX6A
It looks as if the latest estimate for China's Gini is 42.2.
That estimate is from 2012.
5/A Gini of 42.2 would put China in the same neighborhood as the U.S., whose Gini was estimated at 41 in 2013.
I can't find the <30 number anywhere. The only other estimate in the tables for China is from 2008, when it was estimated at 42.8.