But you couldn't pay for the Jobs I did for you.
Celebrities and this public showcasing of being nice.
You and your brand are evil!
Order it! I\u2019ll pay for you.
— Lilo Aderogba \U0001f33a\U0001f33a\U0001f33a (@Liloaderogba) January 6, 2021
Happy new year \U0001f33a \U0001f495 https://t.co/811ncG9ebY
I knew she was going to be really busy...
I was really excited as I'm just a student and just trying to make money for myself, I put into so much effort designing just trying to secure a spot....
She came on again, she wanted to launch Adire t-shirts, I made designs for them and sent them, her PA said she approved them and she posted them.
After I finished the Adire project which she named ADR by LILO...
Mehn I felt really bad, I was down, I had to stay awake all night to get the list of the winners to make the design. Nights upon nights, my efforts, my money spent all for IG tags?!
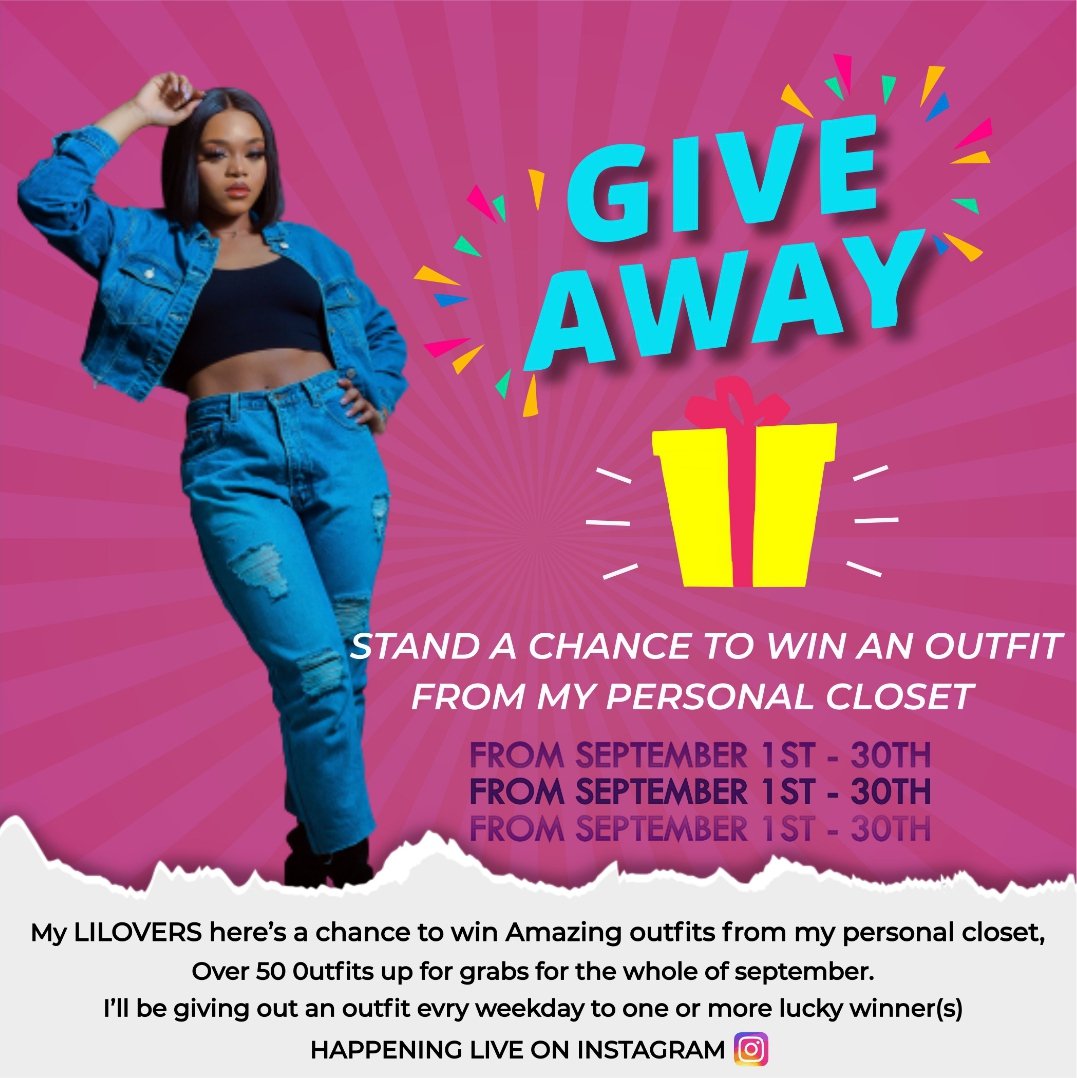
Some of these celebrities do these to up and coming brands and it's really evil. Y'all that do this should fix up!
Your RTs would go a long way getting my voice heard, Getting people know what some of these celebrities do so people can learn and not fall for it.
I could remember going to switch on the generator at 2am and my dad waking up to shout at me for disturbing his sleep "cos of some job I probably won't get paid for" I just begged him and went on to work and I didn't even know it would be all for nothing! pic.twitter.com/K2HTw1n9yh
— Enitan (@bolu__temi) January 6, 2021

More from Society

A long thread on how an obsessive & violent antisemite & Holocaust denier has been embraced by the international “community of the good.”
Sarah Wilkinson has a history of Holocaust denial & anti-Jewish hatred dating back (in documented examples) to around 2015.
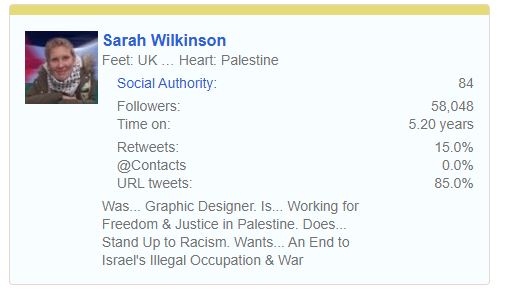
She is a self-proclaimed British activist for “Palestinian rights” but is more accurately a far Left neo-Nazi. Her son shares the same characteristics of violence, racism & Holocaust denial.
I first documented Sarah Wilkinson’s Holocaust denial back in July 2016. I believe I was the 1st person to do so.
Since then she has produced a long trail of written hate and abuse. See here for a good summary.
Wilkinson has recently been publicly celebrated by @XRebellionUK over her latest violent action against a Jewish owned business. Despite many people calling XR’s attention to her history, XR have chosen to remain in alliance with this neo-Nazi.
Former Labour Shadow Chancellor John McDonnell MP is among those who also chose to stand with Wilkinson via a tweet.
But McDonnell is not alone.
Neo-Nazi Sarah Wilkinson is supported and encouraged by thousands of those on the Left who consider themselves “anti-racists”.
Sarah Wilkinson has a history of Holocaust denial & anti-Jewish hatred dating back (in documented examples) to around 2015.
She is a self-proclaimed British activist for “Palestinian rights” but is more accurately a far Left neo-Nazi. Her son shares the same characteristics of violence, racism & Holocaust denial.
I first documented Sarah Wilkinson’s Holocaust denial back in July 2016. I believe I was the 1st person to do so.
Since then she has produced a long trail of written hate and abuse. See here for a good summary.
The internet is forever. https://t.co/zxBV7rjskB
— Heidi Bachram (@HeidiBachram) February 2, 2021
Wilkinson has recently been publicly celebrated by @XRebellionUK over her latest violent action against a Jewish owned business. Despite many people calling XR’s attention to her history, XR have chosen to remain in alliance with this neo-Nazi.
Former Labour Shadow Chancellor John McDonnell MP is among those who also chose to stand with Wilkinson via a tweet.
But McDonnell is not alone.
Neo-Nazi Sarah Wilkinson is supported and encouraged by thousands of those on the Left who consider themselves “anti-racists”.


Two things can be true at once:
1. There is an issue with hostility some academics have faced on some issues
2. Another academic who himself uses threats of legal action to bully colleagues into silence is not a good faith champion of the free speech cause
I have kept quiet about Matthew's recent outpourings on here but as my estwhile co-author has now seen fit to portray me as an enabler of oppression I think I have a right to reply. So I will.
I consider Matthew to be a colleague and a friend, and we had a longstanding agreement not to engage in disputes on twitter. I disagree with much in the article @UOzkirimli wrote on his research in @openDemocracy but I strongly support his right to express such critical views
I therefore find it outrageous that Matthew saw fit to bully @openDemocracy with legal threats, seeking it seems to stifle criticism of his own work. Such behaviour is simply wrong, and completely inconsistent with an academic commitment to free speech.
I am not embroiling myself in the various other cases Matt lists because, unlike him, I think attention to the detail matters and I don't have time to research each of these cases in detail.
1. There is an issue with hostility some academics have faced on some issues
2. Another academic who himself uses threats of legal action to bully colleagues into silence is not a good faith champion of the free speech cause
How about Selina Todd, Kathleen Stock, Jo Phoenix, Rachel Ara, Sarah Honeychurch, Michele Moore, Nina Power, Joanna Williams, Jenny Murray, Julia Gasper ...
— Matt Goodwin (@GoodwinMJ) February 17, 2021
Or is it only Eric you pop at?
Are they all making it up too Rob?
Are they "beyond parody"? https://t.co/drQssTD0OL
I have kept quiet about Matthew's recent outpourings on here but as my estwhile co-author has now seen fit to portray me as an enabler of oppression I think I have a right to reply. So I will.
I consider Matthew to be a colleague and a friend, and we had a longstanding agreement not to engage in disputes on twitter. I disagree with much in the article @UOzkirimli wrote on his research in @openDemocracy but I strongly support his right to express such critical views
I therefore find it outrageous that Matthew saw fit to bully @openDemocracy with legal threats, seeking it seems to stifle criticism of his own work. Such behaviour is simply wrong, and completely inconsistent with an academic commitment to free speech.
I am not embroiling myself in the various other cases Matt lists because, unlike him, I think attention to the detail matters and I don't have time to research each of these cases in detail.