1 January 2021 #MAGAanalysis #HappyNewYear2021
The Forward View + A Table of Contents For Our J.E. Dyer @OptimisticCon's 10 Threads
To be sure, happiness in this New Year's moment has an even more ephemeral feeling than usual, and perhaps by a good deal. Yet it is here.
More from Pasquale "Pat" Scopelliti
From the Middle of the Night File, up again after a few hours decent sleep, I was doing some organizing for tomorrow's thread. And what do I find? Once again Twitter has broken one of my threads. Yesterday morning's. It was a 4-tweet thread. I can only see 27 tweets.
2) I don't know what I'm going to do about it. That's a bridge too far. If I didn't have the thread reader app unroll above, I'd be checking my memory of my work. Thank goodness at least that's there!
45 - 27 = 18
Twitter disappeared 18 of my tweets. And they're not random.
3) At the same time, look what I find in my feed. Two announcements composed in identical format. I'll point out what's wrong with these "clarifications" below. This is from
4) And this from
5) Isn't it interesting that both clarifications follow the exact same series of questions and answers? Obviously this is from the legal department, as if it were information to be shared. It is not. It is very, very carefully NOT information. Focus on that.
Bonjour, the unroll you asked for: @ThyConsigliori: 21 December 2020 #MAGAanalysis #HeMightBeRight A Shocking Theory - He Might Be Right Today, we'll\u2026 https://t.co/2c7UPUKSAU Have a good day. \U0001f916
— Thread Reader App (@threadreaderapp) December 22, 2020
2) I don't know what I'm going to do about it. That's a bridge too far. If I didn't have the thread reader app unroll above, I'd be checking my memory of my work. Thank goodness at least that's there!
45 - 27 = 18
Twitter disappeared 18 of my tweets. And they're not random.
3) At the same time, look what I find in my feed. Two announcements composed in identical format. I'll point out what's wrong with these "clarifications" below. This is from
Newsmax just aired this note to "clarify" its coverage of Smartmatic and Dominion. pic.twitter.com/I5XZ7CQpAk
— John Whitehouse (@existentialfish) December 21, 2020
4) And this from
Fox News hosts caught in a web of lies. Maria Bartiromo, Jeanine Pirro, Lou Dobbs all forced by the network to air exact same video of an expert debunking all the conspiracy theories they\u2019ve been peddling. Expect it to run on Hannity, Tucker, and Laura too. pic.twitter.com/lJrMO2m7l4
— Mike Sington (@MikeSington) December 20, 2020
5) Isn't it interesting that both clarifications follow the exact same series of questions and answers? Obviously this is from the legal department, as if it were information to be shared. It is not. It is very, very carefully NOT information. Focus on that.

More from Society


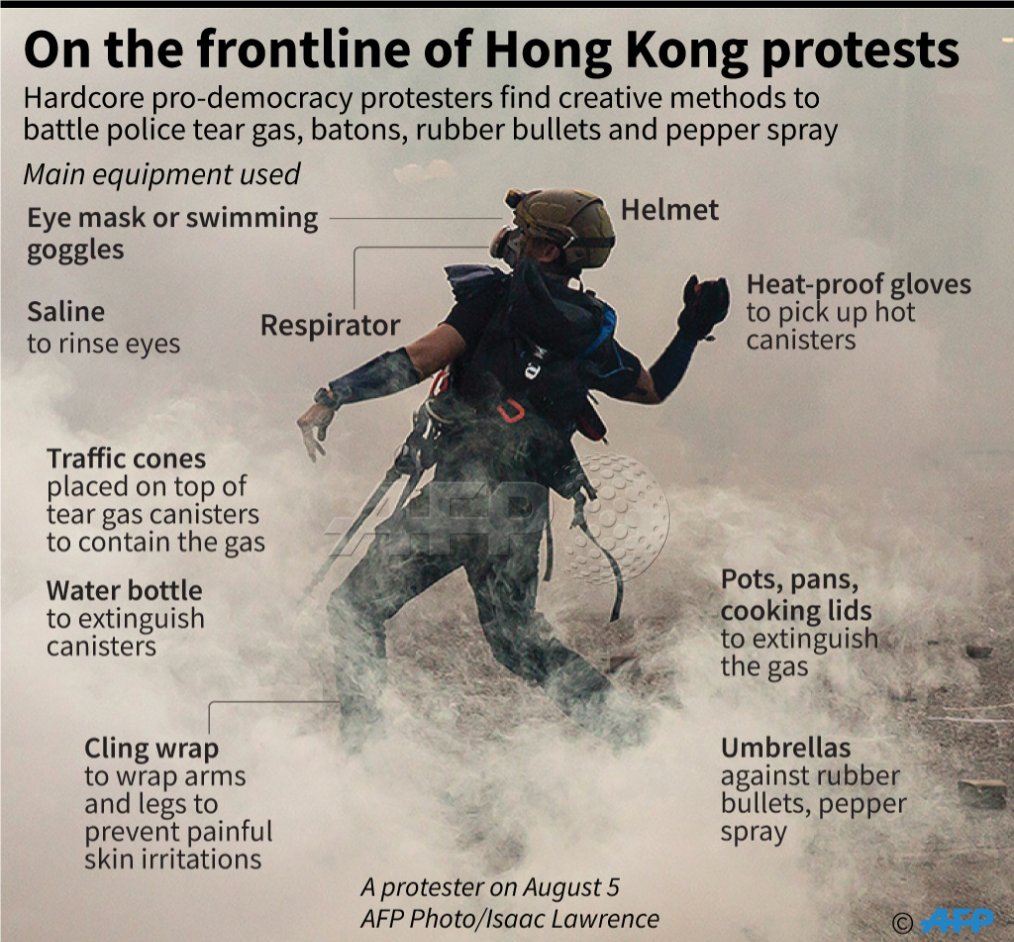
Hong Kong protester equipment list:
- respirator (dubbed "pig snouts" in Cantonese)
- helmet
- eye mask
- heat-proof gloves
- water bottle
- cling wrap
- saline
- traffic cones
- pots and pans
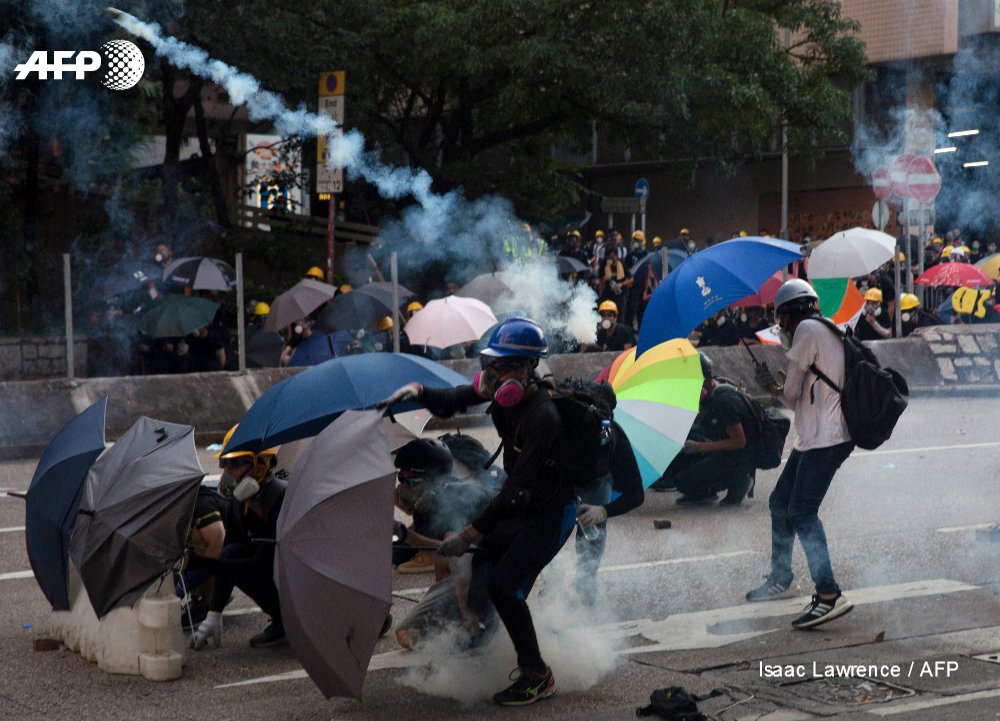
Demonstrators find creative methods to battle police tear gas
https://t.co/kPeUTu9iFh
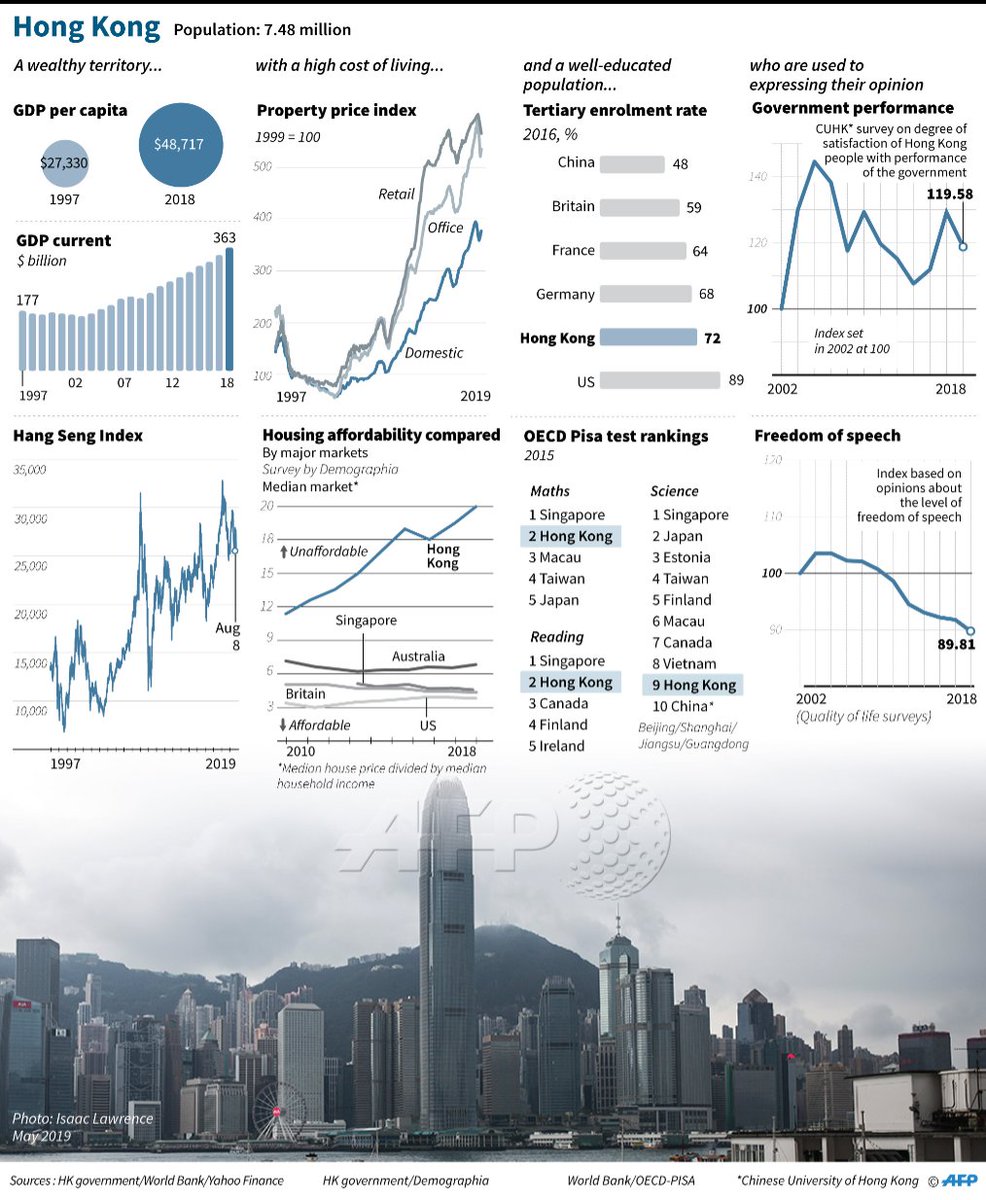
AFP graphic charting Hong Kong's main socio-economic indicators and opinion polls on press freedom and government performance
@AFPgraphics
AFP graphic showing the main equipment used by hardcore pro-democracy protesters in Hong Kong to battle police tear gas, pepper spray and rubber bullets
@AFPgraphics
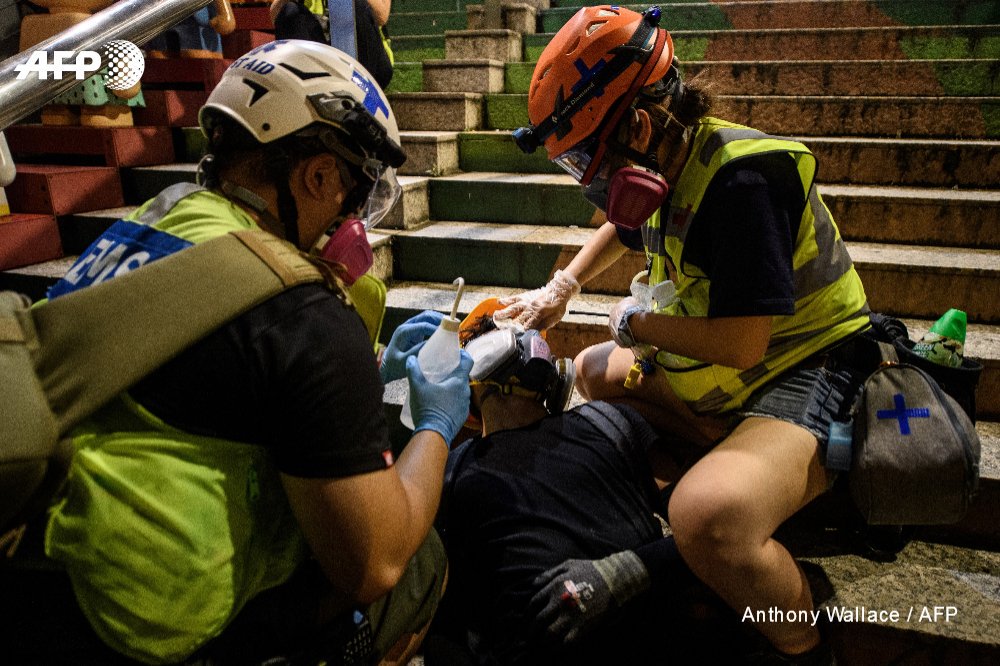
Frontline first aid.
Nurses, doctors, medical students and ordinary citizens with first aid training have clamoured to join a small volunteer corps helping treat people involved in the Hong Kong protests
@AFP's Yan Zhao reports: https://t.co/uDfYkMeZJf
📸 Anthony Wallace
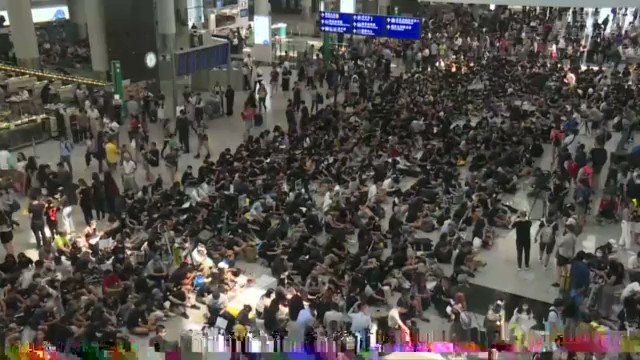
Pro-democracy activists kick off three days of rallies at Hong Kong airport.
Protesters hope to win international support from arriving passengers. The last demonstration at the airport on July 26 passed off peacefully without causing flight disruptions
https://t.co/jmVqtEd4M2
- respirator (dubbed "pig snouts" in Cantonese)
- helmet
- eye mask
- heat-proof gloves
- water bottle
- cling wrap
- saline
- traffic cones
- pots and pans
Demonstrators find creative methods to battle police tear gas
https://t.co/kPeUTu9iFh
AFP graphic charting Hong Kong's main socio-economic indicators and opinion polls on press freedom and government performance
@AFPgraphics
AFP graphic showing the main equipment used by hardcore pro-democracy protesters in Hong Kong to battle police tear gas, pepper spray and rubber bullets
@AFPgraphics
Frontline first aid.
Nurses, doctors, medical students and ordinary citizens with first aid training have clamoured to join a small volunteer corps helping treat people involved in the Hong Kong protests
@AFP's Yan Zhao reports: https://t.co/uDfYkMeZJf
📸 Anthony Wallace
Pro-democracy activists kick off three days of rallies at Hong Kong airport.
Protesters hope to win international support from arriving passengers. The last demonstration at the airport on July 26 passed off peacefully without causing flight disruptions
https://t.co/jmVqtEd4M2


You May Also Like


@franciscodeasis https://t.co/OuQaBRFPu7
Unfortunately the "This work includes the identification of viral sequences in bat samples, and has resulted in the isolation of three bat SARS-related coronaviruses that are now used as reagents to test therapeutics and vaccines." were BEFORE the

chimeric infectious clone grants were there.https://t.co/DAArwFkz6v is in 2017, Rs4231.
https://t.co/UgXygDjYbW is in 2016, RsSHC014 and RsWIV16.
https://t.co/krO69CsJ94 is in 2013, RsWIV1. notice that this is before the beginning of the project
starting in 2016. Also remember that they told about only 3 isolates/live viruses. RsSHC014 is a live infectious clone that is just as alive as those other "Isolates".
P.D. somehow is able to use funds that he have yet recieved yet, and send results and sequences from late 2019 back in time into 2015,2013 and 2016!
https://t.co/4wC7k1Lh54 Ref 3: Why ALL your pangolin samples were PCR negative? to avoid deep sequencing and accidentally reveal Paguma Larvata and Oryctolagus Cuniculus?
Unfortunately the "This work includes the identification of viral sequences in bat samples, and has resulted in the isolation of three bat SARS-related coronaviruses that are now used as reagents to test therapeutics and vaccines." were BEFORE the
chimeric infectious clone grants were there.https://t.co/DAArwFkz6v is in 2017, Rs4231.
https://t.co/UgXygDjYbW is in 2016, RsSHC014 and RsWIV16.
https://t.co/krO69CsJ94 is in 2013, RsWIV1. notice that this is before the beginning of the project
starting in 2016. Also remember that they told about only 3 isolates/live viruses. RsSHC014 is a live infectious clone that is just as alive as those other "Isolates".
P.D. somehow is able to use funds that he have yet recieved yet, and send results and sequences from late 2019 back in time into 2015,2013 and 2016!
https://t.co/4wC7k1Lh54 Ref 3: Why ALL your pangolin samples were PCR negative? to avoid deep sequencing and accidentally reveal Paguma Larvata and Oryctolagus Cuniculus?