I hate when I learn something new (to me) & stunning about the Jeff Epstein network (h/t MoodyKnowsNada.)
Where to begin?
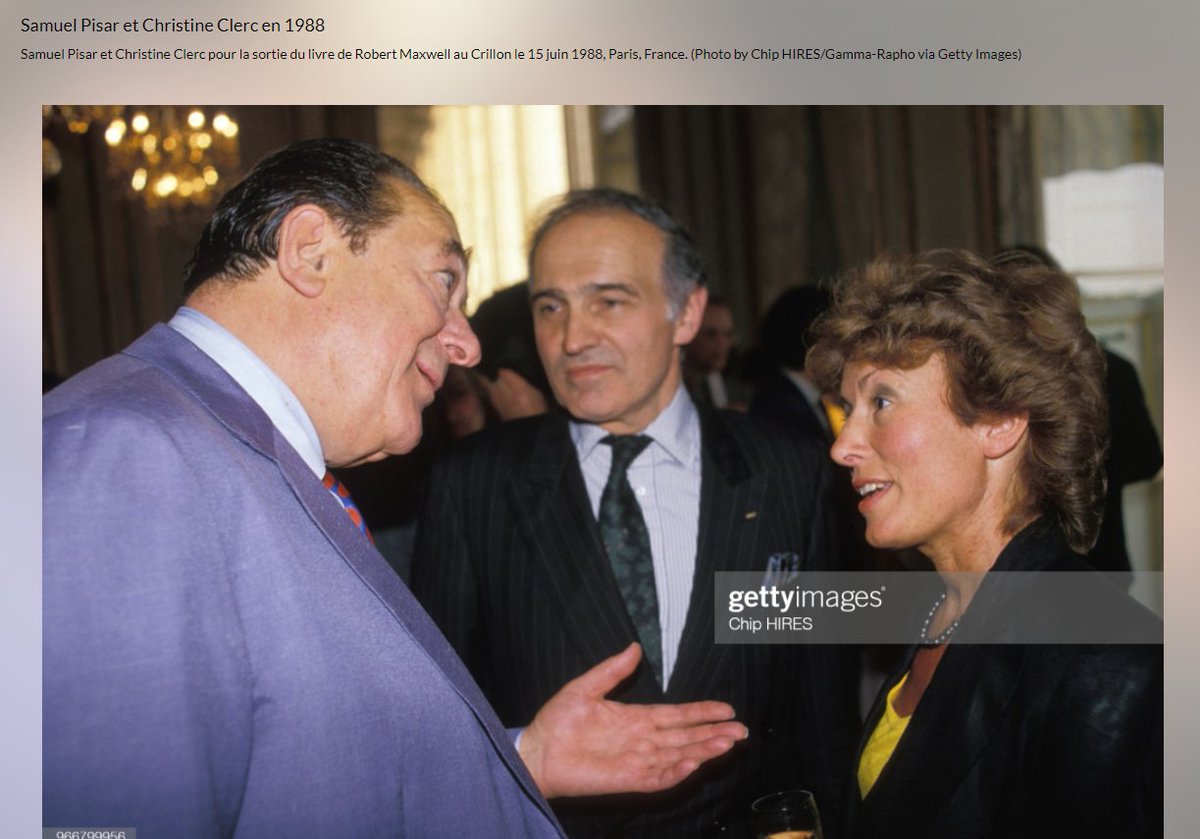
So our new Secretary of State Anthony Blinken's stepfather, Samuel Pisar, was "longtime lawyer and confidant of...Robert Maxwell," Ghislaine Maxwell's Dad.
"Pisar was one of the last people to speak to Maxwell, by phone, probably an hour before the chairman of Mirror Group Newspapers fell off his luxury yacht the Lady Ghislaine on 5 November, 1991."
https://t.co/DAEgchNyTP
OK, so that's just a coincidence. Moving on, Anthony Blinken "attended the prestigious Dalton School in New York City"...wait, what?
https://t.co/DnE6AvHmJgDalton School...Dalton School...rings a
Oh that's right.
The dad of the U.S. Attorney General under both George W. Bush & Donald Trump, William Barr, was headmaster of the Dalton School.
Donald Barr was also quite a
I'm not going to even mention that Blinken's stepdad Sam Pisar's name was in Epstein's "black book."
Lots of names in that book. I mean, for example, Cuomo, Trump, Clinton, Prince Andrew, Bill Cosby, Woody Allen - all in that book, and their reputations are spotless.