
We could make our Defense cheaper. We could reinstate conscription. We could transfer large portions of our standing forces into guard and reserve units. We could stop invading central and southwest asian countries. We could increase direct military aid to our allies.
And, good point. But my recollection of that time period was that in Afghanistan, the CIA and SOF had the Taliban and al qaeda just about licked within a few months.
More from Society


Sandbank Danger, A Thread

Controversy Has Been Caused By The Digging Of A Narrow Channel By A Resort On A Sandbank Near K. Hinmafushi.

Hinmafushi Council President Shan Ibrahim Stated To Sun That The Resort, Which Dug The Trench Creating A River On The Sandbank, Did Not Have Ownership Over The Sandbank.
Officials From The Island Of Hinmafushi Had Traveled To The Sandbank To Stop The Process Of Digging The Trench When They Became Aware Of It, Said Shan.
Officials Were Now Redepositing The Sand Removed From The Sandbank.
Controversy Has Been Caused By The Digging Of A Narrow Channel By A Resort On A Sandbank Near K. Hinmafushi.
Hinmafushi Council President Shan Ibrahim Stated To Sun That The Resort, Which Dug The Trench Creating A River On The Sandbank, Did Not Have Ownership Over The Sandbank.
Officials From The Island Of Hinmafushi Had Traveled To The Sandbank To Stop The Process Of Digging The Trench When They Became Aware Of It, Said Shan.
Officials Were Now Redepositing The Sand Removed From The Sandbank.
— Ahmed Aznil (@AhmedAznil) January 21, 2021

Shall we do a thread of Blue Checks spewing hatred towards Rush Limbaugh and the rest of us on the Right?
https://t.co/eXLNam2gv4

https://t.co/eXLNam2gv4
Good. Fuck Rush Limbaugh, and let the celebration about his death be a reminder to the rest of the racists and bigots that we\u2019ll happily dance on your graves too.
— Chris Kluwe, Irredeemable Pudgy Nobody (@ChrisWarcraft) February 17, 2021

You May Also Like


**Thread on Bravery of Sikhs**
(I am forced to do this due to continuous hounding of Sikh Extremists since yesterday)
Rani Jindan Kaur, wife of Maharaja Ranjit Singh had illegitimate relations with Lal Singh (PM of Ranjit Singh). Along with Lal Singh, she attacked Jammu, burnt - https://t.co/EfjAq59AyI

Hindu villages of Jasrota, caused rebellion in Jammu, attacked Kishtwar.
Ancestors of Raja Ranjit Singh, The Sansi Tribe used to give daughters as concubines to Jahangir.

The Ludhiana Political Agency (Later NW Fronties Prov) was formed by less than 4000 British soldiers who advanced from Delhi and reached Ludhiana, receiving submissions of all sikh chiefs along the way. The submission of the troops of Raja of Lahore (Ranjit Singh) at Ambala.
Dabistan a contemporary book on Sikh History tells us that Guru Hargobind broke Naina devi Idol Same source describes Guru Hargobind serving a eunuch
YarKhan. (ref was proudly shared by a sikh on twitter)
Gobind Singh followed Bahadur Shah to Deccan to fight for him.

In Zafarnama, Guru Gobind Singh states that the reason he was in conflict with the Hill Rajas was that while they were worshiping idols, while he was an idol-breaker.
And idiot Hindus place him along Maharana, Prithviraj and Shivaji as saviours of Dharma.

(I am forced to do this due to continuous hounding of Sikh Extremists since yesterday)
Rani Jindan Kaur, wife of Maharaja Ranjit Singh had illegitimate relations with Lal Singh (PM of Ranjit Singh). Along with Lal Singh, she attacked Jammu, burnt - https://t.co/EfjAq59AyI
Tomorrow again same thing happens bcoz fudus like you are creating a narrative oh Khalistan. when farmers are asking MSP. (RSS ki tatti khane wale Kerni sena ke kutte).
— Ancient Economist (@_stock_tips) December 5, 2020
U kill sikhs in 1984 just politics. To BC low IQ fudu Saale entire history was politics.
Hindu villages of Jasrota, caused rebellion in Jammu, attacked Kishtwar.
Ancestors of Raja Ranjit Singh, The Sansi Tribe used to give daughters as concubines to Jahangir.
The Ludhiana Political Agency (Later NW Fronties Prov) was formed by less than 4000 British soldiers who advanced from Delhi and reached Ludhiana, receiving submissions of all sikh chiefs along the way. The submission of the troops of Raja of Lahore (Ranjit Singh) at Ambala.
Dabistan a contemporary book on Sikh History tells us that Guru Hargobind broke Naina devi Idol Same source describes Guru Hargobind serving a eunuch
YarKhan. (ref was proudly shared by a sikh on twitter)
Gobind Singh followed Bahadur Shah to Deccan to fight for him.
In Zafarnama, Guru Gobind Singh states that the reason he was in conflict with the Hill Rajas was that while they were worshiping idols, while he was an idol-breaker.
And idiot Hindus place him along Maharana, Prithviraj and Shivaji as saviours of Dharma.

The Eye of Horus. 1/*

I believe that @ripple_crippler and @looP_rM311_7211 are the same person. I know, nobody believes that. 2/*
Today I want to prove that Mr Pool smile faces mean XRP and price increase. In Ripple_Crippler, previous to Mr Pool existence, smile faces were frequent. They were very similar to the ones Mr Pool posts. The eyes also were usually a couple of "x", in fact, XRP logo. 3/*

The smile XRP-eyed face also appears related to the Moon. XRP going to the Moon. 4/*

And smile XRP-eyed faces also appear related to Egypt. In particular, to the Eye of Horus. https://t.co/i4rRzuQ0gZ 5/*

I believe that @ripple_crippler and @looP_rM311_7211 are the same person. I know, nobody believes that. 2/*
Today I want to prove that Mr Pool smile faces mean XRP and price increase. In Ripple_Crippler, previous to Mr Pool existence, smile faces were frequent. They were very similar to the ones Mr Pool posts. The eyes also were usually a couple of "x", in fact, XRP logo. 3/*
The smile XRP-eyed face also appears related to the Moon. XRP going to the Moon. 4/*
And smile XRP-eyed faces also appear related to Egypt. In particular, to the Eye of Horus. https://t.co/i4rRzuQ0gZ 5/*
**Thread on Bravery of Sikhs**
(I am forced to do this due to continuous hounding of Sikh Extremists since yesterday)
Rani Jindan Kaur, wife of Maharaja Ranjit Singh had illegitimate relations with Lal Singh (PM of Ranjit Singh). Along with Lal Singh, she attacked Jammu, burnt - https://t.co/EfjAq59AyI
Hindu villages of Jasrota, caused rebellion in Jammu, attacked Kishtwar.
Ancestors of Raja Ranjit Singh, The Sansi Tribe used to give daughters as concubines to Jahangir.
The Ludhiana Political Agency (Later NW Fronties Prov) was formed by less than 4000 British soldiers who advanced from Delhi and reached Ludhiana, receiving submissions of all sikh chiefs along the way. The submission of the troops of Raja of Lahore (Ranjit Singh) at Ambala.
Dabistan a contemporary book on Sikh History tells us that Guru Hargobind broke Naina devi Idol Same source describes Guru Hargobind serving a eunuch
YarKhan. (ref was proudly shared by a sikh on twitter)
Gobind Singh followed Bahadur Shah to Deccan to fight for him.
In Zafarnama, Guru Gobind Singh states that the reason he was in conflict with the Hill Rajas was that while they were worshiping idols, while he was an idol-breaker.
And idiot Hindus place him along Maharana, Prithviraj and Shivaji as saviours of Dharma.
(I am forced to do this due to continuous hounding of Sikh Extremists since yesterday)
Rani Jindan Kaur, wife of Maharaja Ranjit Singh had illegitimate relations with Lal Singh (PM of Ranjit Singh). Along with Lal Singh, she attacked Jammu, burnt - https://t.co/EfjAq59AyI
Tomorrow again same thing happens bcoz fudus like you are creating a narrative oh Khalistan. when farmers are asking MSP. (RSS ki tatti khane wale Kerni sena ke kutte).
— Ancient Economist (@_stock_tips) December 5, 2020
U kill sikhs in 1984 just politics. To BC low IQ fudu Saale entire history was politics.
Hindu villages of Jasrota, caused rebellion in Jammu, attacked Kishtwar.
Ancestors of Raja Ranjit Singh, The Sansi Tribe used to give daughters as concubines to Jahangir.
The Ludhiana Political Agency (Later NW Fronties Prov) was formed by less than 4000 British soldiers who advanced from Delhi and reached Ludhiana, receiving submissions of all sikh chiefs along the way. The submission of the troops of Raja of Lahore (Ranjit Singh) at Ambala.
Dabistan a contemporary book on Sikh History tells us that Guru Hargobind broke Naina devi Idol Same source describes Guru Hargobind serving a eunuch
YarKhan. (ref was proudly shared by a sikh on twitter)
Gobind Singh followed Bahadur Shah to Deccan to fight for him.
In Zafarnama, Guru Gobind Singh states that the reason he was in conflict with the Hill Rajas was that while they were worshiping idols, while he was an idol-breaker.
And idiot Hindus place him along Maharana, Prithviraj and Shivaji as saviours of Dharma.

Speech Delay is most common in children nowadays
In ancient times, our grandparents used to follow typical natural way of caring the needs of a child. All they used were more of natural products than chemical based for the growth of child.

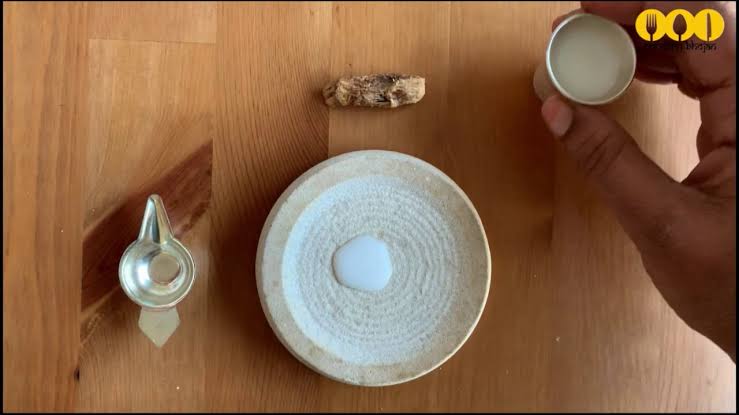
One of major step followed was to feed Gurbach Jadd/ Vasa Kommu/ Acorus Calamus for initiating good speech ability in a child. This stem was needed to babies on Tuesdays and Sundays in mother's milk.
Vasa is feed to baby after the 1st bath on 12th day in week. Weekly only thrice it is fed and named as :
Budhwar - Budhi Vasa
Mangalwar - Vaak Vasa
Ravi Vaar - Aayush Vasa
This stem is burnt and rubbed against the grinding stone in mother's milk or warm water to get a paste
The procedure to make it is in the link
https://t.co/uo4sGp7mUm
It should not be given daily to the child. Other main benefits are
1. It clears the phlegm in child's throat caused due to continuous milk intake. It clears the tracts and breathing is effortless.
2. Digestion
For children who haven't got their speech and is delayed than usual should feed this vasa on these days in week atleast for 6months. Don't get carried away with this dialogue
"Some gain speech little late"
In ancient times, our grandparents used to follow typical natural way of caring the needs of a child. All they used were more of natural products than chemical based for the growth of child.
One of major step followed was to feed Gurbach Jadd/ Vasa Kommu/ Acorus Calamus for initiating good speech ability in a child. This stem was needed to babies on Tuesdays and Sundays in mother's milk.
Vasa is feed to baby after the 1st bath on 12th day in week. Weekly only thrice it is fed and named as :
Budhwar - Budhi Vasa
Mangalwar - Vaak Vasa
Ravi Vaar - Aayush Vasa
This stem is burnt and rubbed against the grinding stone in mother's milk or warm water to get a paste
The procedure to make it is in the link
https://t.co/uo4sGp7mUm
It should not be given daily to the child. Other main benefits are
1. It clears the phlegm in child's throat caused due to continuous milk intake. It clears the tracts and breathing is effortless.
2. Digestion
For children who haven't got their speech and is delayed than usual should feed this vasa on these days in week atleast for 6months. Don't get carried away with this dialogue
"Some gain speech little late"