
To me, very easy things to get behind.
Like most movements, I have learned that the definition of feminism has expanded to include simply treating women like human beings.
(A thread for whoever feels like reading)
Neighborhood gents, what\u2019s something you\u2019ve learned about feminism (or gained a better understanding of) that you think other men should know?
— feminist next door (@emrazz) February 19, 2021
Note - the quoted is a friendly/good faith replier. https://t.co/048kuxxX6q
To me, very easy things to get behind.
All examples of terms they use to demean a man who respects women.
To paraphrase what a wise man on this app said:
Some men hate women so much, they hate men who don’t hate women
One stark difference is the amount of harassment received online.
I have dealt with racists, every so often. They really can’t do much but hurl a slur then block.
They run obsessive campaigns.
(I put “both groups” in quotes because rarely are misogynists and racists not one and the same. )
More from Society

Tomorrow, January 6th, MAGA chuds, Proud Boys, and white supremacists are planned to descend on Washington D.C. to contest the election. Among them will be NSC-131, a New England based neo-Nazi organization. Let's welcome them by saying hi to one of their members, Eddie Stuart!
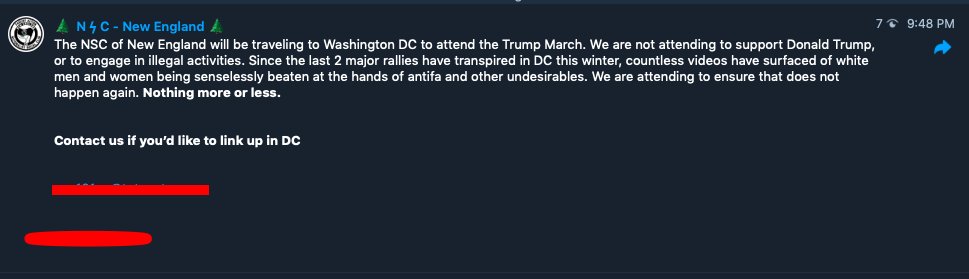
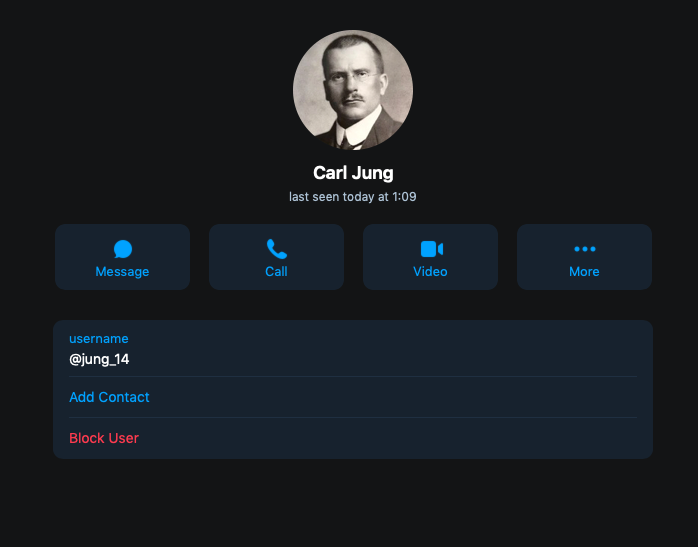
Edward Stuart, from Chester, New Hampshire, has been a member of Nationalist Social Club (NSC) since the very beginning and is a staple participant in their actions. He is known in NSC chats as "Carl Jung" and is well connected in the New England Nazi scene.
2/
NSC-131 is a neo-Nazi group that was started in Massachusetts in early 2020 by Chris Hood. You can learn more about NSC and it's members in these threads:
Eddie describes his ideology as "Esoteric Hitlerism" which is an occult form of Nazism that literally worships Adolf Hitler as a god, or, specifically, as an incarnation of the Hindu God Vishnu. Here is Ed holding the RigVeda with some of his occult Nazi pals. Interesting Ed!
4/
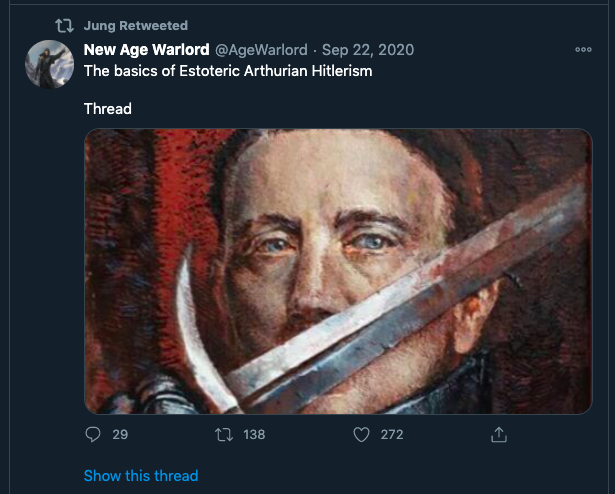
Much of this ideological insight was gained from Eddie's Twitter, where he originally used his "Carl Jung" persona and reposts explicit neo-fascist content and racist memes. In one edited picture, Eddie can be seen at an NSC event in late June 2020 holding a Nazi Sonnenrad flag
5
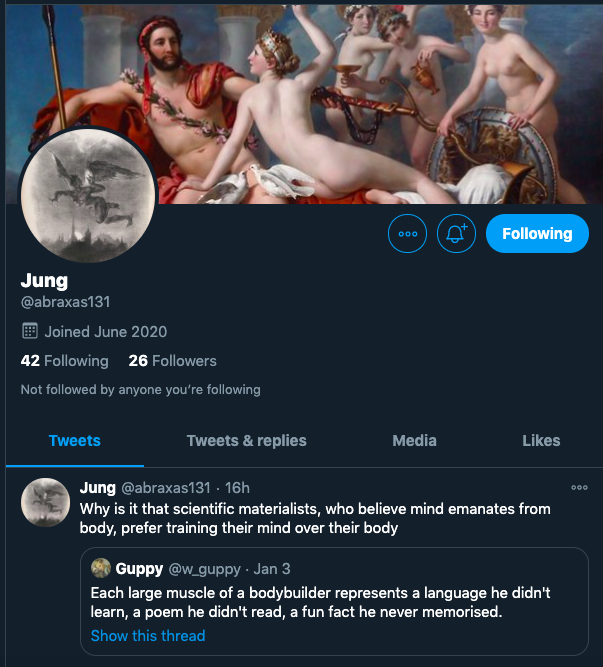
Edward Stuart, from Chester, New Hampshire, has been a member of Nationalist Social Club (NSC) since the very beginning and is a staple participant in their actions. He is known in NSC chats as "Carl Jung" and is well connected in the New England Nazi scene.
2/
NSC-131 is a neo-Nazi group that was started in Massachusetts in early 2020 by Chris Hood. You can learn more about NSC and it's members in these threads:
1/ Let\u2019s talk about a III%er turned Proud Boy turned Resist Marxism turned Patriot Front turned The Base affiliate.
— AntiFash Gordon (@AntiFashGordon) April 10, 2020
He now runs a new crew, the National Socialist Club, based on football hooliganism.\u2070\u2070
Some of you already know him.\u2070\u2070
His name is Chris Hood, of Boston, MA. pic.twitter.com/nXAxWugHcu
Eddie describes his ideology as "Esoteric Hitlerism" which is an occult form of Nazism that literally worships Adolf Hitler as a god, or, specifically, as an incarnation of the Hindu God Vishnu. Here is Ed holding the RigVeda with some of his occult Nazi pals. Interesting Ed!
4/
Much of this ideological insight was gained from Eddie's Twitter, where he originally used his "Carl Jung" persona and reposts explicit neo-fascist content and racist memes. In one edited picture, Eddie can be seen at an NSC event in late June 2020 holding a Nazi Sonnenrad flag
5


A long thread on how an obsessive & violent antisemite & Holocaust denier has been embraced by the international “community of the good.”
Sarah Wilkinson has a history of Holocaust denial & anti-Jewish hatred dating back (in documented examples) to around 2015.
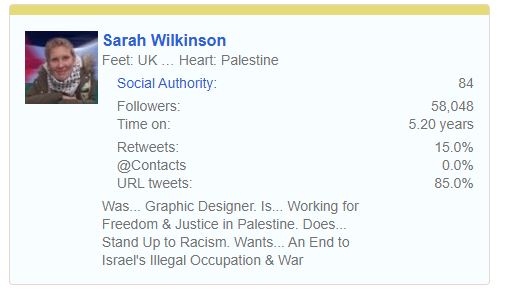
She is a self-proclaimed British activist for “Palestinian rights” but is more accurately a far Left neo-Nazi. Her son shares the same characteristics of violence, racism & Holocaust denial.
I first documented Sarah Wilkinson’s Holocaust denial back in July 2016. I believe I was the 1st person to do so.
Since then she has produced a long trail of written hate and abuse. See here for a good summary.
Wilkinson has recently been publicly celebrated by @XRebellionUK over her latest violent action against a Jewish owned business. Despite many people calling XR’s attention to her history, XR have chosen to remain in alliance with this neo-Nazi.
Former Labour Shadow Chancellor John McDonnell MP is among those who also chose to stand with Wilkinson via a tweet.
But McDonnell is not alone.
Neo-Nazi Sarah Wilkinson is supported and encouraged by thousands of those on the Left who consider themselves “anti-racists”.
Sarah Wilkinson has a history of Holocaust denial & anti-Jewish hatred dating back (in documented examples) to around 2015.
She is a self-proclaimed British activist for “Palestinian rights” but is more accurately a far Left neo-Nazi. Her son shares the same characteristics of violence, racism & Holocaust denial.
I first documented Sarah Wilkinson’s Holocaust denial back in July 2016. I believe I was the 1st person to do so.
Since then she has produced a long trail of written hate and abuse. See here for a good summary.
The internet is forever. https://t.co/zxBV7rjskB
— Heidi Bachram (@HeidiBachram) February 2, 2021
Wilkinson has recently been publicly celebrated by @XRebellionUK over her latest violent action against a Jewish owned business. Despite many people calling XR’s attention to her history, XR have chosen to remain in alliance with this neo-Nazi.
Former Labour Shadow Chancellor John McDonnell MP is among those who also chose to stand with Wilkinson via a tweet.
But McDonnell is not alone.
Neo-Nazi Sarah Wilkinson is supported and encouraged by thousands of those on the Left who consider themselves “anti-racists”.

I’ll address every nonsense argument and lie used to defend the suicidal gender ideology Thats in vogue today:
3:45 - “So what if you don’t have gametes?”
It’s called a birth defect. You’re still male or female.
~5:00 *nonsense trying to say the sexes of seahorses could be swapped coz male carry the eggs*
male doesn’t produce eggs, he produces the sperm. He’s still the male. If I impregnated a chick then carried the amniotic sac in a backpack ‘til the baby was done I’ll still be male🤦♂️
5:10 - we could say there’s 4 sexes of fruit fly cause there’s 3 producers of different sized sperm
No. They’re still producing sperm. They’re males. This is idiotic. Is this whole video like this? (Probably. 99% likely. Abandon hope.)
~6:10 - hermaphroditism and sequential hermaphroditism exists therefore....
No. Some animals being hermaphrodites, which is meaningless w/o the existence of binary sex to contrast it to, still doesn’t make gender ideology or transgenderism valid.
Intersex ≠ transgenderism 🙄
6:20 - bilateral gynandromorphism is a disorder in some species (not in humans). Has nothing to do w/ “gender” or transgenderism.
Ova-testes in humans are also a disorder, usually found in those w/ the karyotype disorders that you ppl also try to appropriate (extra X’s/Y’s).
3:45 - “So what if you don’t have gametes?”
It’s called a birth defect. You’re still male or female.
*one horrible doctor does a horrible thing* "oh I guess gender is horrible" miss me with that transphobic nonsense
— Goob \u26a1 (@Goob999) February 17, 2021
Here's a video to even disprove your take on sex (not gender) and the binary:https://t.co/bpmqqJWoJX
~5:00 *nonsense trying to say the sexes of seahorses could be swapped coz male carry the eggs*
male doesn’t produce eggs, he produces the sperm. He’s still the male. If I impregnated a chick then carried the amniotic sac in a backpack ‘til the baby was done I’ll still be male🤦♂️
5:10 - we could say there’s 4 sexes of fruit fly cause there’s 3 producers of different sized sperm
No. They’re still producing sperm. They’re males. This is idiotic. Is this whole video like this? (Probably. 99% likely. Abandon hope.)
~6:10 - hermaphroditism and sequential hermaphroditism exists therefore....
No. Some animals being hermaphrodites, which is meaningless w/o the existence of binary sex to contrast it to, still doesn’t make gender ideology or transgenderism valid.
Intersex ≠ transgenderism 🙄
6:20 - bilateral gynandromorphism is a disorder in some species (not in humans). Has nothing to do w/ “gender” or transgenderism.
Ova-testes in humans are also a disorder, usually found in those w/ the karyotype disorders that you ppl also try to appropriate (extra X’s/Y’s).


