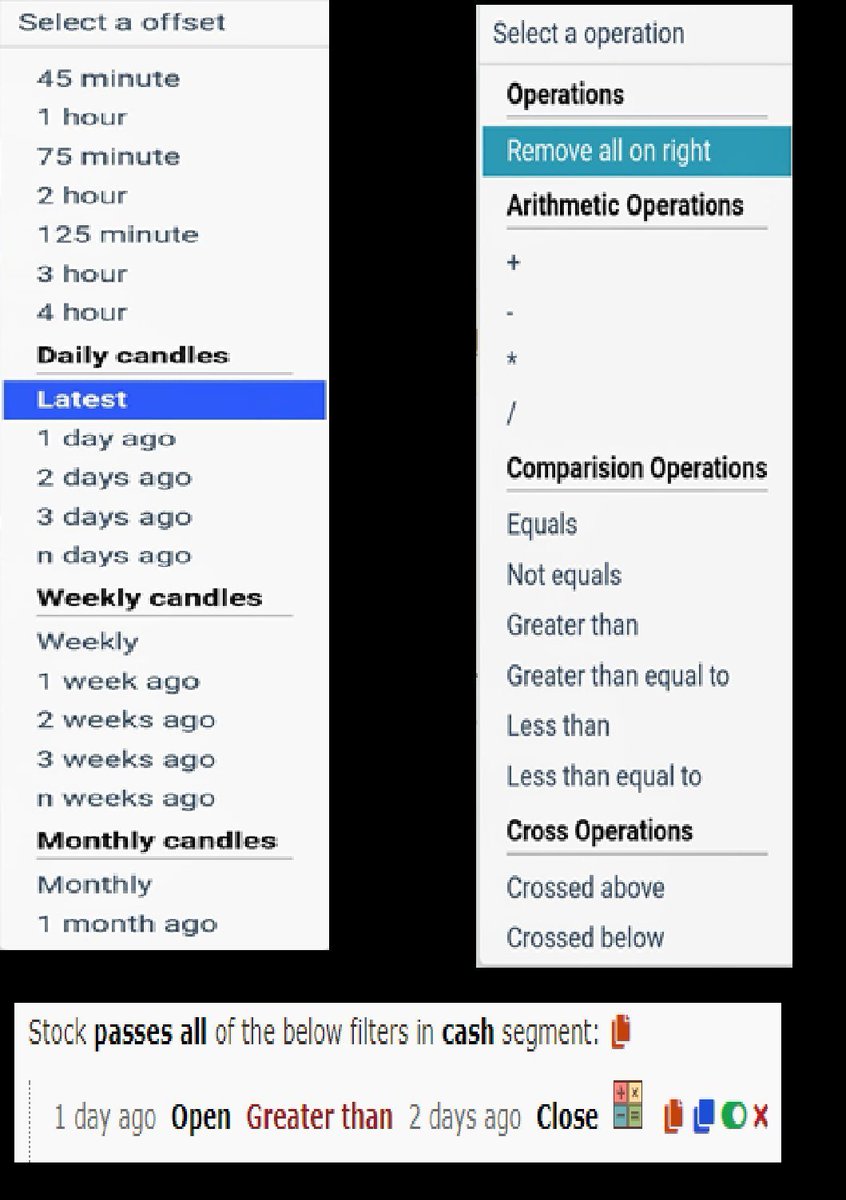
How to Avoid Big Losses In trading ?
1. Avoid Stocks Below 200 ema
2. Sell Stocks in Stage 4 Down Trend
3. Dont Trade Stocks that are moving in Circuits
4. Avoid News based Trading
A thread With examples🧵
Retweet to Educate Your Trading Friends !
A Study Shows that 90% of the winning Stocks stay above 200 ema before a big Advancing Phase
1. Simply Not Holding or Buying Stocks below 200 ema Saves a lot of time and Money.
2. You can looses opportunity Cost if you buy stocks below 200 ema.
3. TimeFrame: Daily 200 ema
2/n
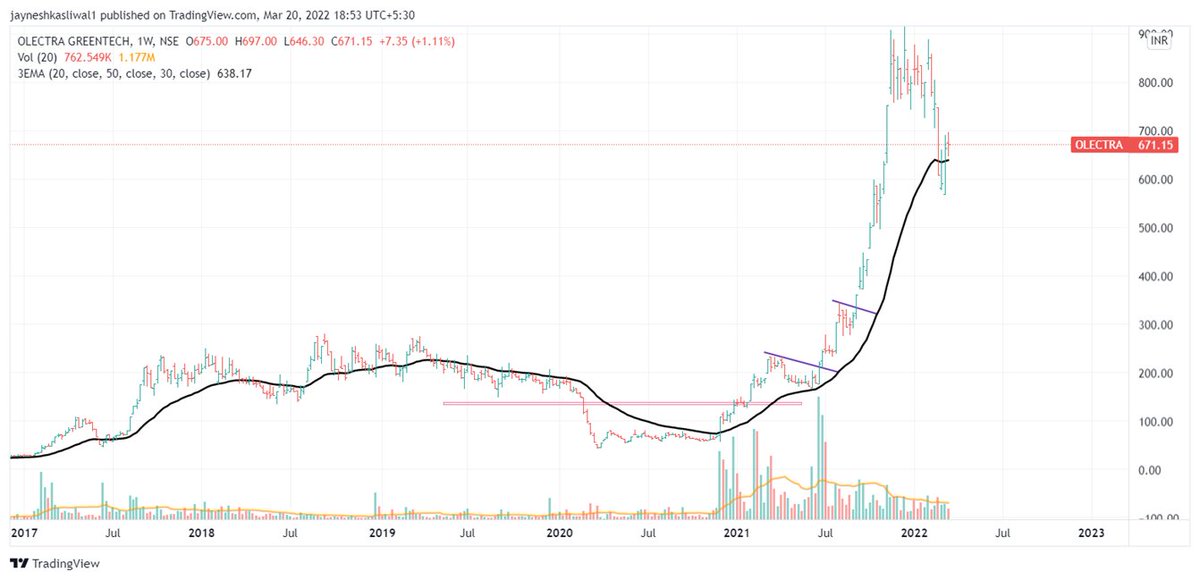
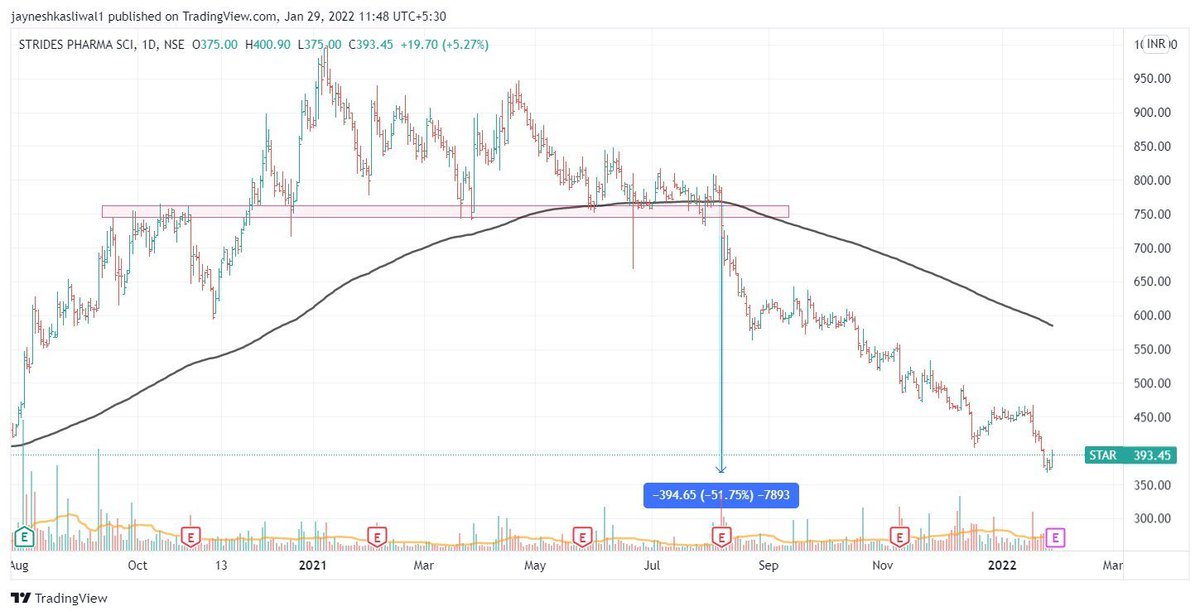
B. Sell Stocks in Stage 4 Down Trend
1. Stocks Exhibiting this are in complete Bear Grip
2. The 30 week ema acts as reference for stage analysis
3. These Stocks can be short sold on pullback to 30wema
4. Happens after Topping Phase
5. TimeFrame : Weekly , 30 Week Ema
3/n
C. Dont Trade Stocks that are moving in Circuits
1. Mostly these stocks are Speculatve and Operator Driven.
2. You never know what is the top of the trend and may get Stuck with Huge Losses
Example : TTML , Alok , Ruchi etc
This is Pyramid Structure and news driven also
4/n
D. Avoid News based Trading
1. Whenever a postive News comes in Market People Jump in Buying the Stocks without thinking .
2. Most of the the times the news is factored in or gets factored after heavy buying
3. Good News can also be bad
Example : PnbBousing , AdaniPower
5/n