This is done to:
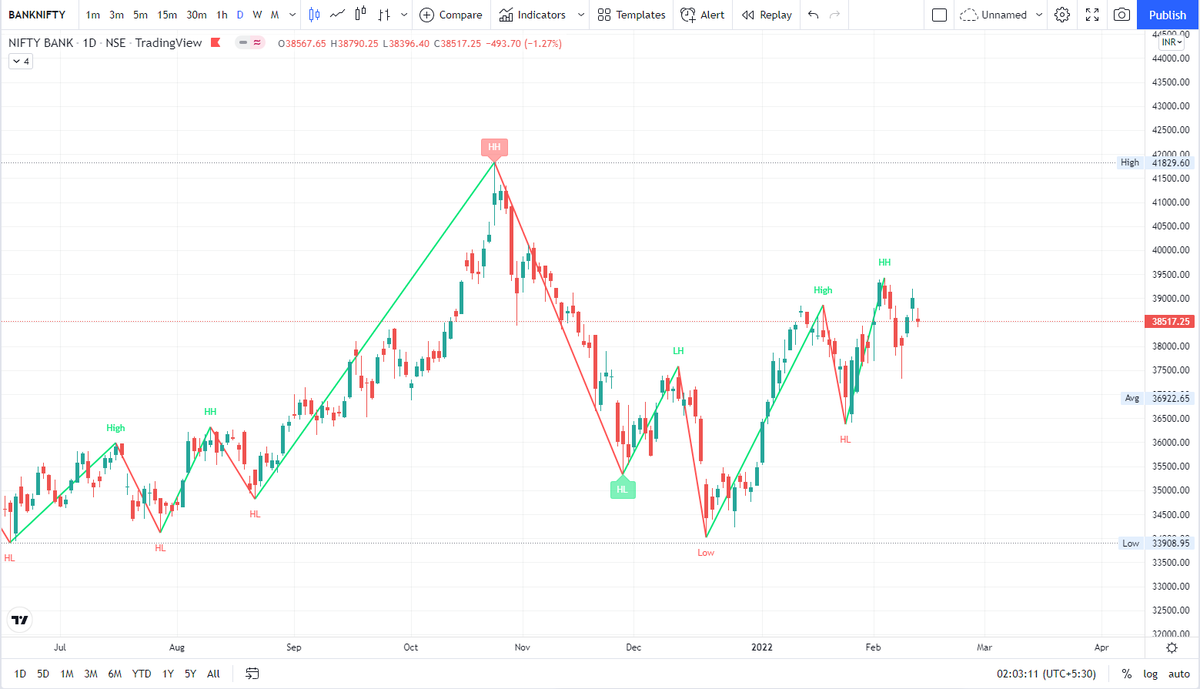
- Find the structure (HH-HL means bullish, LH-LL means bearish)
- Align trades with the trend on the longer timeframe
- Find important Support/Resistance levels
- Trendlines
She does this to find the direction and levels.


I curated a list on 13 examples of Weekly Bank Nifty analysis by @niki_poojary, chronologically: \U0001f9f5
— Aditya Todmal (@AdityaTodmal) February 12, 2022
https://t.co/Ngoc5bh906 Thank Mahek bhai for making this video basis my set up which i have been following since past 2 yr I\u2019m not promoting this software, neither I 'll gain any referral if anyone subscribes for this software ,Purpose is to share help fellow traders!\U0001f60a
— itrade(DJ) (@ITRADE191) September 5, 2021
5. A THREAD on . . . .
— Aditya Todmal (@AdityaTodmal) July 11, 2021
How @ITRADE191 selects strikes to trade in and how he follows risk management.
Short thread explained via pictures with the help of @niki_poojary.https://t.co/YiYYaIReNS
6. Thread on how @ITRADE191 made 3 lakhs in 2 days.
— Aditya Todmal (@AdityaTodmal) July 11, 2021
You will need:
1. Pivots
2. Vwap
3. PDL/PDH (Previous day high/low)
4. Advance/Decline Ratio.https://t.co/o9tLOaLpEh
7. DJ @ITRADE191 multiple chart analysis for INTRADAY TRADING.
— Aditya Todmal (@AdityaTodmal) July 11, 2021
1. Core setup
2. Pivot points trades
3. PDH/PDL trades
4. Open interest addictions combined with rejections on charts.
5. Website to confirm biashttps://t.co/qZQCWOSisa
If you want to trade only stocks with established trend/momentum, then you can look for stocks which have never(or barely did) closed below a certain MA (say 50MA) in the last say 50 days.
— Manas Arora (@iManasArora) November 8, 2021
There are countless ways to run scans. Just have to get creative. #BroTip
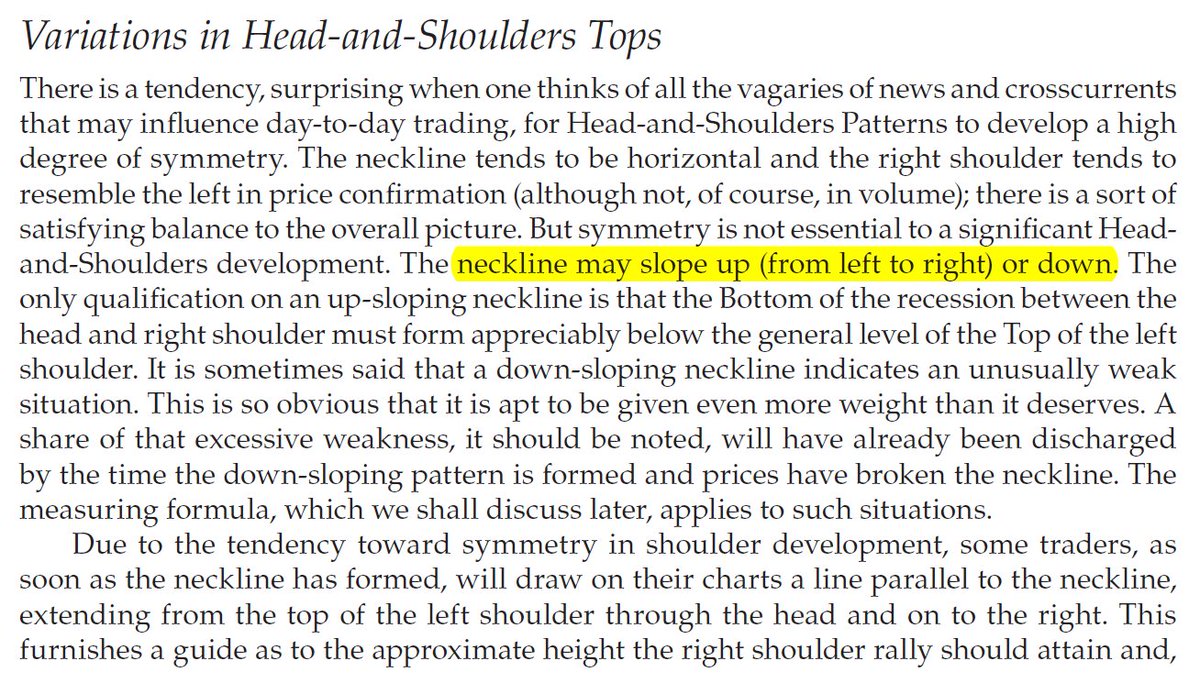
Sir Edwards & Magee discussed sloping necklines in H&S in their classical work. I am considering this breakdown by Affle as an H&S top breakdown with a target open of 770.
— The_Chartist \U0001f4c8 (@charts_zone) May 25, 2022
The target also coincides with support at the exact same level. pic.twitter.com/n84kSgkg4q