#Nifty
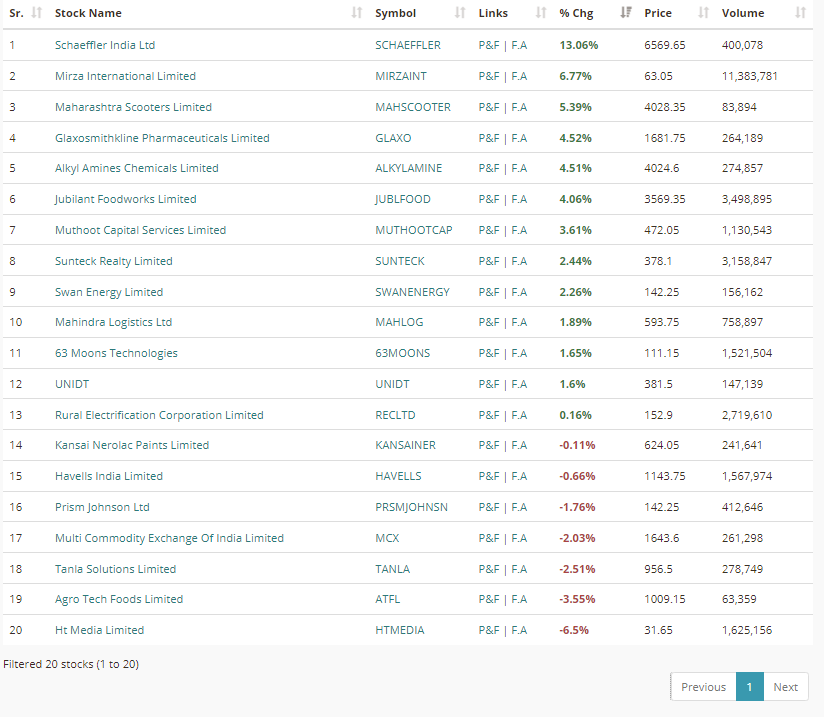
This table has key information.
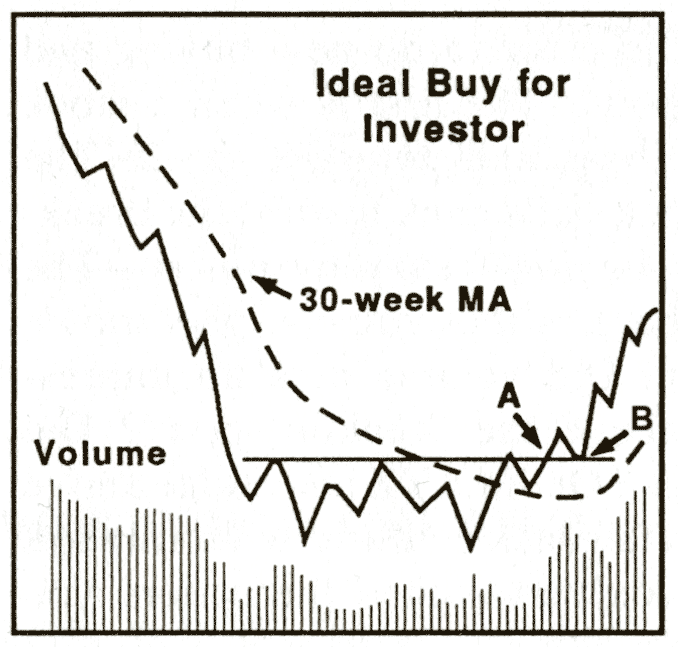
Market has cycles that repeats:
Close > 5-Ema - Up
Close > HEma - UP Trend gaining momentum
Close < HEma - UP Trend losing momentum
Close < 5-Ema - Down
Close < LEma - Down Trend gaining momentum
Close > LEma - Down Trend losing momentum

More from Van Ilango (JustNifty)
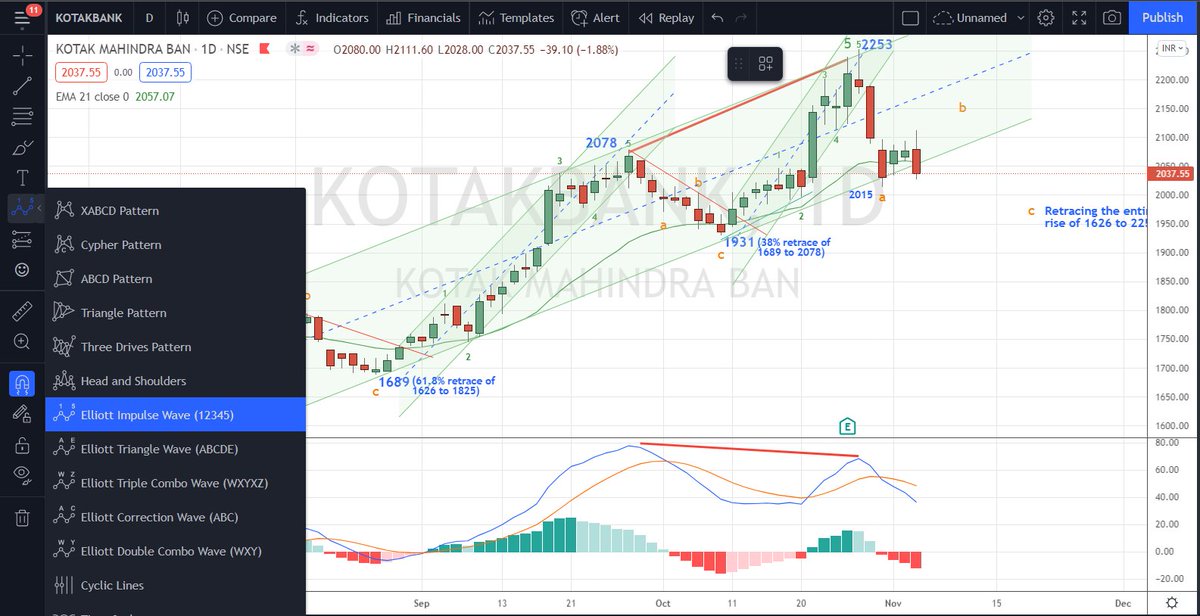
IF #Nifty to go to 18850-19713 & more, heavy weights such as
#Hdfc (3190++)
#Hdfcbank (1724++)
#Reliance (2834++)
#ITC (274++) these are "just min. targets"
& many more would move up significantly
@rlnarayanan https://t.co/iVYE1F7l6v
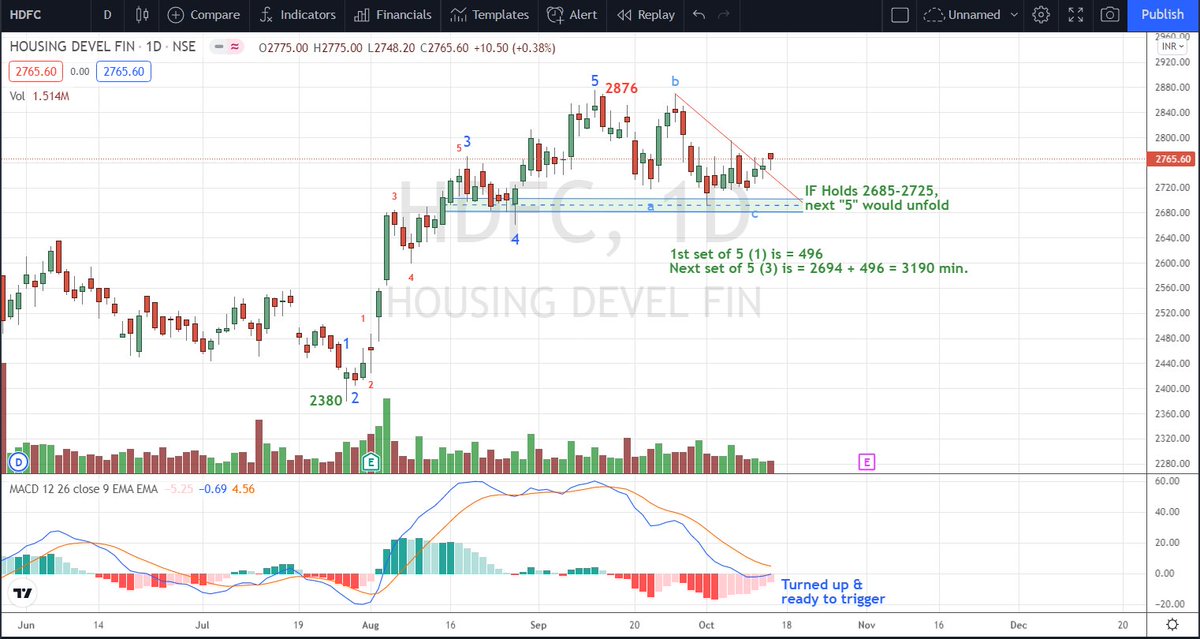
#Hdfc (3190++)
#Hdfcbank (1724++)
#Reliance (2834++)
#ITC (274++) these are "just min. targets"
& many more would move up significantly
@rlnarayanan https://t.co/iVYE1F7l6v
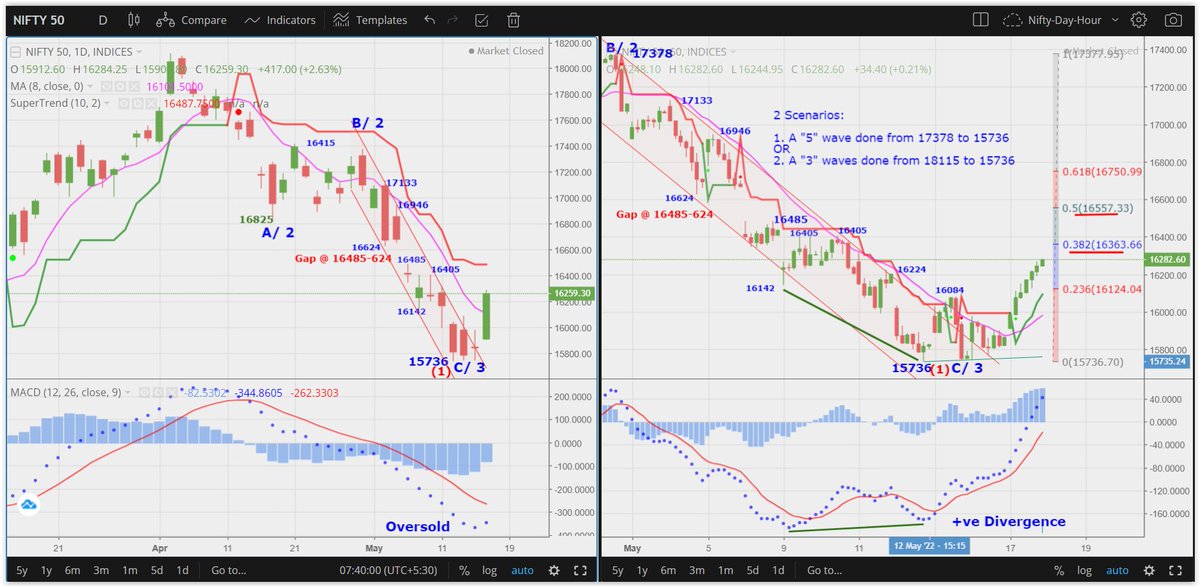
#Nifty 3rd is sub-dividing as in chart:
— Van Ilango (JustNifty) (@JustNifty) October 13, 2021
[1]st: 16396 - 17793 = 1397
[2]nd: 17793-17948-17453 - Irregular flat
[3]rd: 17453+1397=18850 OR
: 17453+1928=19381 OR
: 17453+2096=19549 OR
: 17453+2260=19713 OR
Nothing wrong in projecting till holds "17990"