So proud of my @UNGlobalPulse team and collaborators that step by step and over the years have managed to bring 🤖 science closer to humanitarian and development work. We now have a library!! 📚 📚📚 https://t.co/rOxXQRllo5 Some peer-reviewed highlights in this thread 👇
More from Science


What are the classics of the "Science of Science" or "Meta Science"? If you were teaching a class on the subject, what would go in the syllabus?
Here's a (very disorganized and incomplete) handful of suggestions, which I may add to. Suggestions welcome, especially if you've dug into relevant literatures.
1. The already classic "Estimating the reproducibility of
psychological science" from the Open Science Collaboration of @BrianNosek et al. https://t.co/yjGczLZ6Je
(Look at that abstract, wow!)
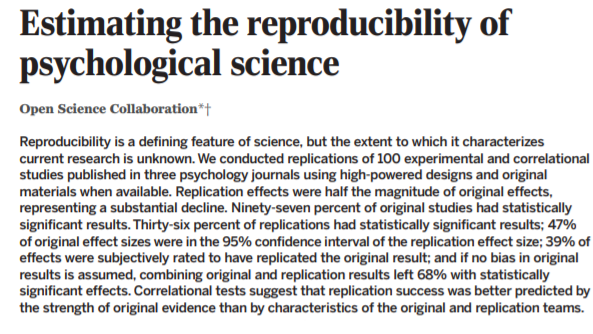
Many people had pointed out problems with standard statistical methods, going back decades (what are the best refs?). But this paper was a sledgehammer, making it impossible to ignore the question: what, if anything, were we actually learning from all those statistical studies?
2. Dean Keith Simonton's book "Creativity in Science: Chance, Logic, Genius, and Zeitgeist". If an essentially scientometric book could be described as a fun romp through science & creativity, this would be it
Here's a (very disorganized and incomplete) handful of suggestions, which I may add to. Suggestions welcome, especially if you've dug into relevant literatures.
1. The already classic "Estimating the reproducibility of
psychological science" from the Open Science Collaboration of @BrianNosek et al. https://t.co/yjGczLZ6Je
(Look at that abstract, wow!)
Many people had pointed out problems with standard statistical methods, going back decades (what are the best refs?). But this paper was a sledgehammer, making it impossible to ignore the question: what, if anything, were we actually learning from all those statistical studies?
2. Dean Keith Simonton's book "Creativity in Science: Chance, Logic, Genius, and Zeitgeist". If an essentially scientometric book could be described as a fun romp through science & creativity, this would be it

You May Also Like


fascinated by this man, mario cortellucci, and his outsized influence on ontario and GTA politics. cortellucci, who lives in vaughan and ran as a far-right candidate for the italian senate back in 2018 - is a major ford donor...
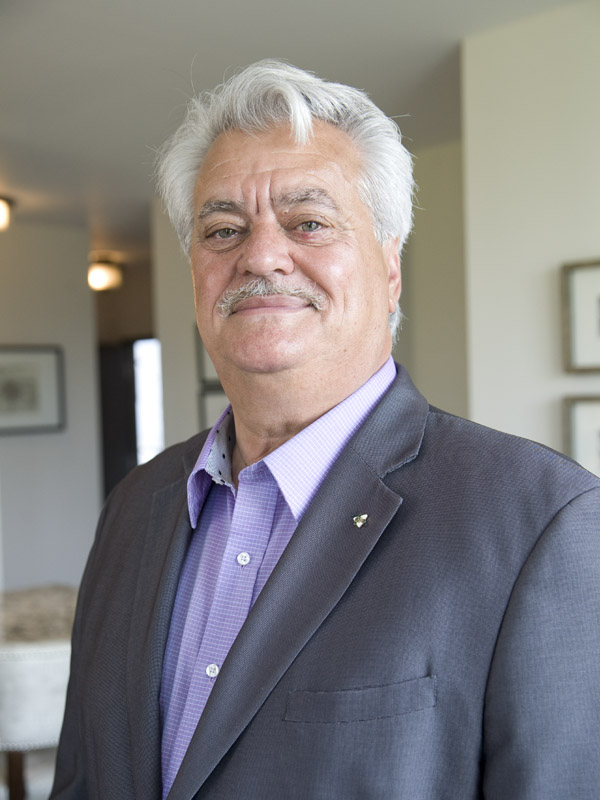
his name might sound familiar because the new cortellucci vaughan hospital at mackenzie health, the one doug ford has been touting lately as a covid-centric facility, is named after him and his family
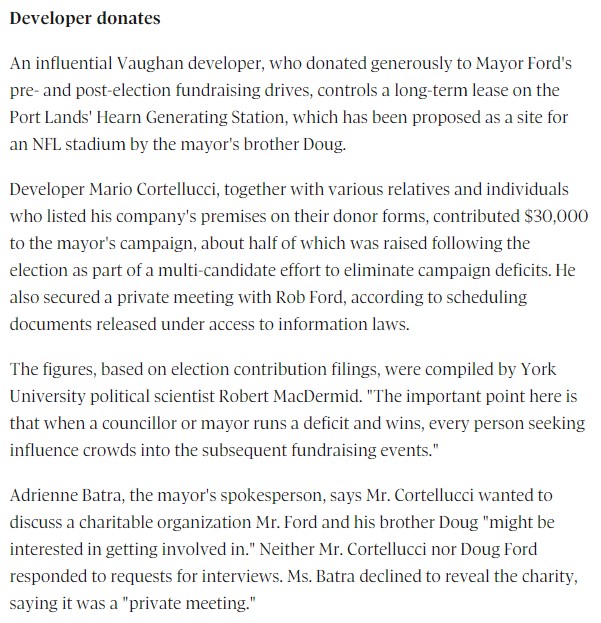
but his name also pops up in a LOT of other ford projects. for instance - he controls the long term lease on big parts of toronto's portlands... where doug ford once proposed building an nfl stadium and monorail... https://t.co/weOMJ51bVF
cortellucci, who is a developer, also owns a large chunk of the greenbelt. doug ford's desire to develop the greenbelt has been
and late last year he rolled back the mandate of conservation authorities there, prompting the resignations of several members of the greenbelt advisory
his name might sound familiar because the new cortellucci vaughan hospital at mackenzie health, the one doug ford has been touting lately as a covid-centric facility, is named after him and his family
but his name also pops up in a LOT of other ford projects. for instance - he controls the long term lease on big parts of toronto's portlands... where doug ford once proposed building an nfl stadium and monorail... https://t.co/weOMJ51bVF
cortellucci, who is a developer, also owns a large chunk of the greenbelt. doug ford's desire to develop the greenbelt has been
and late last year he rolled back the mandate of conservation authorities there, prompting the resignations of several members of the greenbelt advisory