#SAIL
More from Nishant Kumar
More from Sail

SAIL - If I say Sail can do 65-70 in worst case how many hearts will break? 🤪
105 is key, Bulls might defend for the time being. Once they fail during any downtrend Boy Bulls will be in serious trouble.
First targets 90-95 and worst case 65-70 (This i wil review later) https://t.co/RYaMwRQb7e
105 is key, Bulls might defend for the time being. Once they fail during any downtrend Boy Bulls will be in serious trouble.
First targets 90-95 and worst case 65-70 (This i wil review later) https://t.co/RYaMwRQb7e
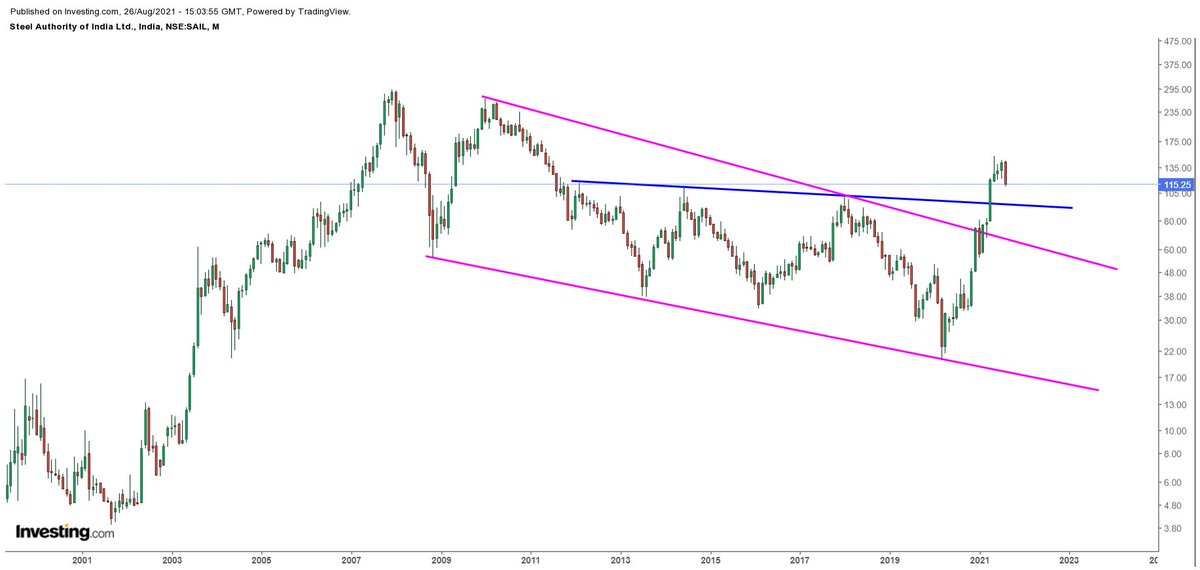
Angle 2 -- On Log scale its end of this upmove from March 2020.
— Shivaji Vitthalrao\U0001f1ee\U0001f1f3 (@shivaji_1983) August 24, 2021
No major support until 90-92.
Conclusion - any rise to 123-128 is a sell opportunity
Bullish only above 145. Personally not bulish.
Potential taregts on downside are 105-90#SAIL pic.twitter.com/yZv2WXwIMU


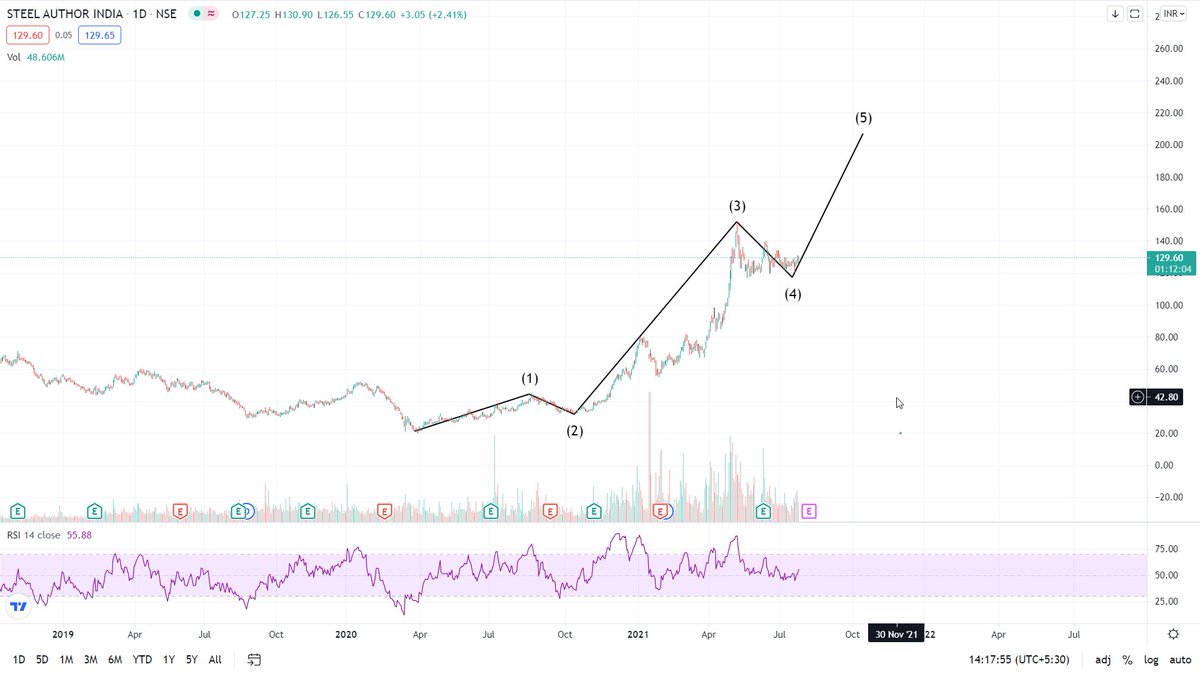
Sail:
Views are for educational purpose.
Riding from levels of 47 (Refer old tweet, tagged)
Impulse wave cycle + subs, completed and now waves adjusted.
This major wave 5 will only unfold, once it gives a closing above 153 levels on a weekly basis.
Pic 1 is for investors https://t.co/d4xtiRI45j
Another condition (refer 2nd image) is formation of a pennant (giving a sneak peak for a BO, closing awaited).
This is for short term / positional players
OI data is skewed because of expiry & will be misleading currently.
DYOR for opportunities
Views are for educational purpose.
Riding from levels of 47 (Refer old tweet, tagged)
Impulse wave cycle + subs, completed and now waves adjusted.
This major wave 5 will only unfold, once it gives a closing above 153 levels on a weekly basis.
Pic 1 is for investors https://t.co/d4xtiRI45j
— Vipul Kankaria (@cobbervipul) May 1, 2021
Another condition (refer 2nd image) is formation of a pennant (giving a sneak peak for a BO, closing awaited).
This is for short term / positional players
OI data is skewed because of expiry & will be misleading currently.
DYOR for opportunities