Same view on #Reliance 👍
5 waves from 1998 bottom
5 waves from 2015 bottom
5 waves from 2020 bottom
All on verge of completion on weekly and monthly charts
**3288** the level above which if it moves, need to re-evaluate analysis
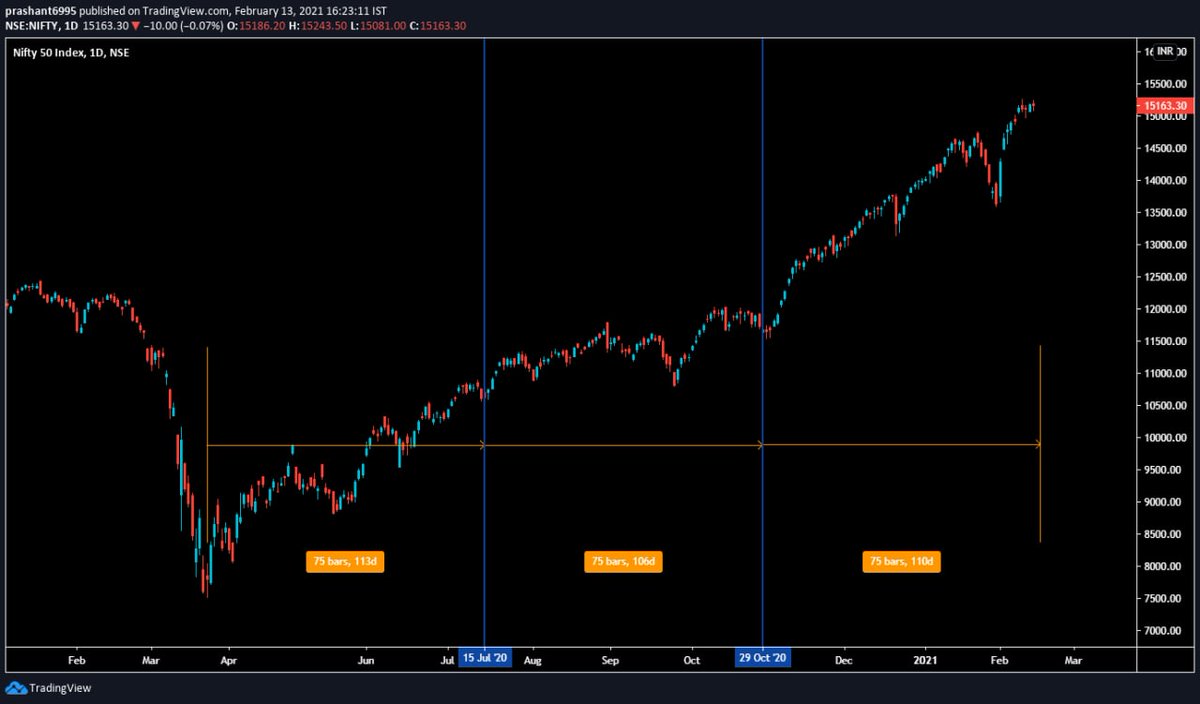
IT'S ALL ABOUT CYCLES
#ElliottWaves https://t.co/gqaP855BxM
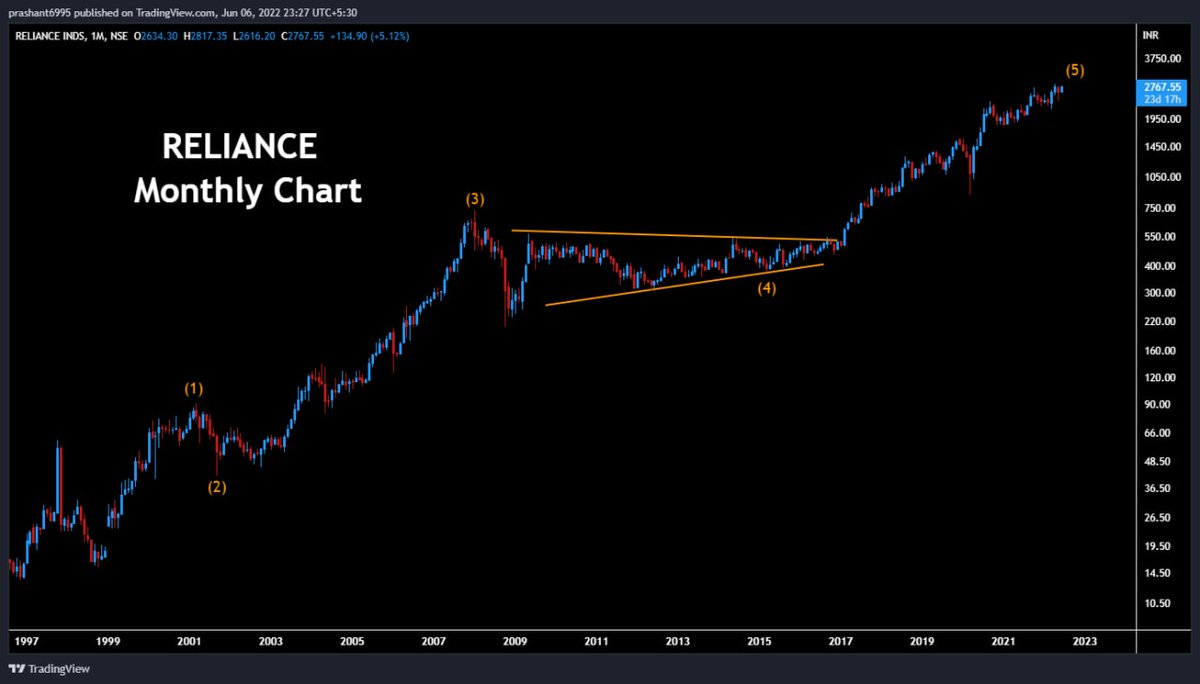
#Reliance - Near completion of 5 waves from bottom in 98. Period of 2008-2015 was a clear triangle (wave 4)
— Harsh / \ud5c8\uc26c (@_Harsh_Mehta_) June 6, 2022
Some upside still possible but every rise calls for caution. https://t.co/9xjWbR1wn4 pic.twitter.com/gkz9WiUS2Y
More from Prashant Bhansali
#EW
Here's my view based on EW purely for long term
We could witness a big big 3rd wave in coming months
#investmentidea https://t.co/5laFyd8A7X
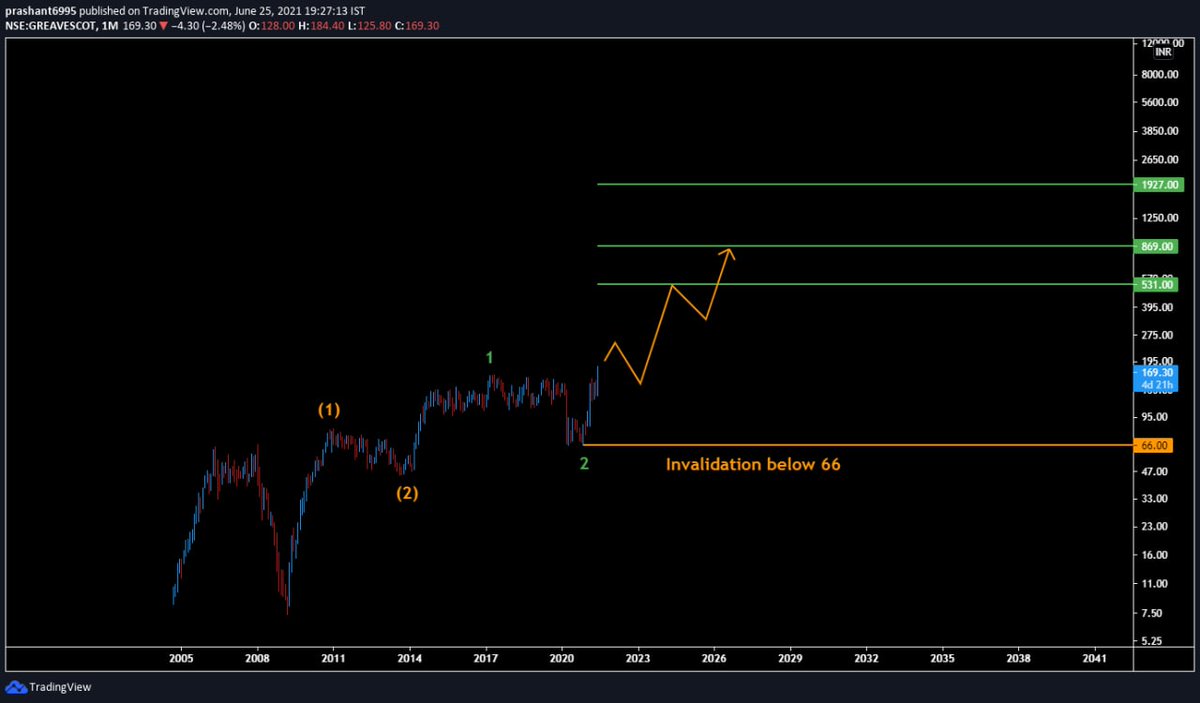
(30) #GreavesCotton monthly chart
— Prashant Bhansali (@prashant280294) June 25, 2021
Big monthly breakout underway
Is it time to move to next orbit higher ? Looks like! #PB365 pic.twitter.com/CB0OtIow7G
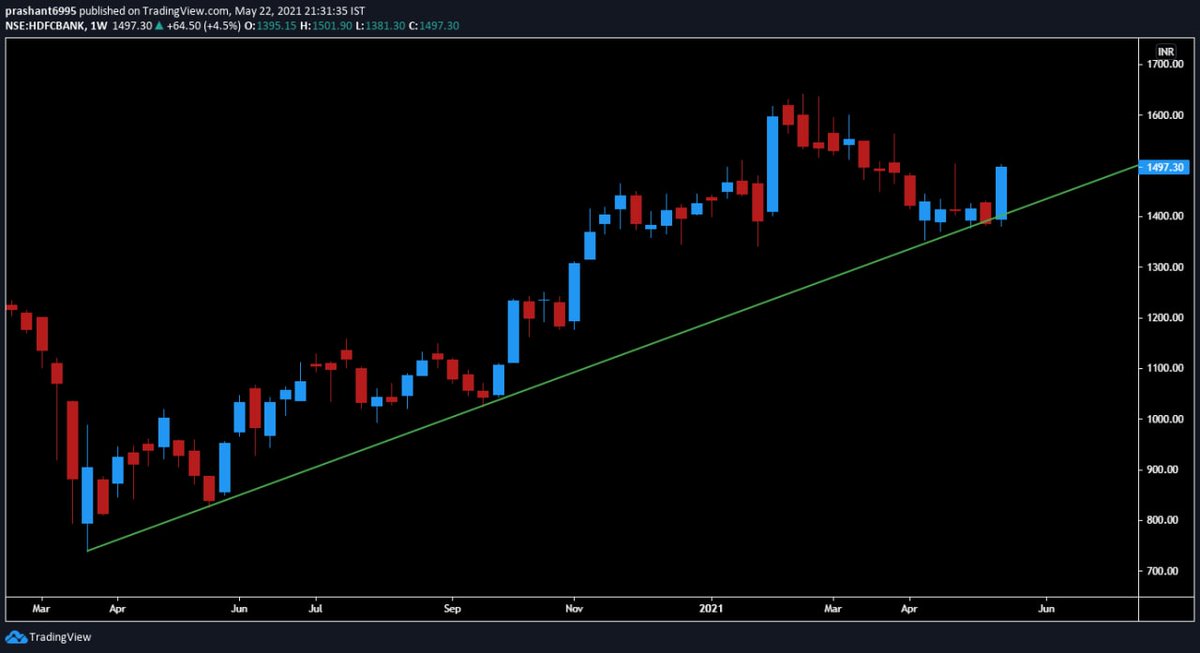

Not looking good.
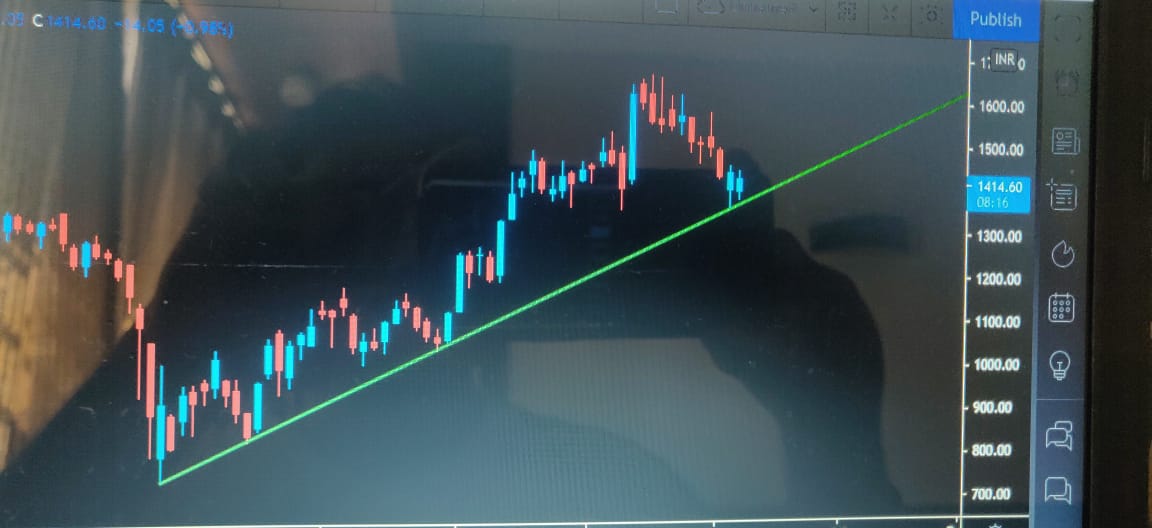
#RELIANCE update
— Prashant Bhansali (@prashant280294) April 28, 2022
Was expecting 5th wave rally towards 2800-3000 as mentioned in previous post
Move played out, but now not worth chasing anymore
Not saying the move is over, it can still go up bit more, but riskreward not good for positional longs now on, I would stay away. https://t.co/eoLshLoLBD pic.twitter.com/G0qZAEBRIX
You May Also Like


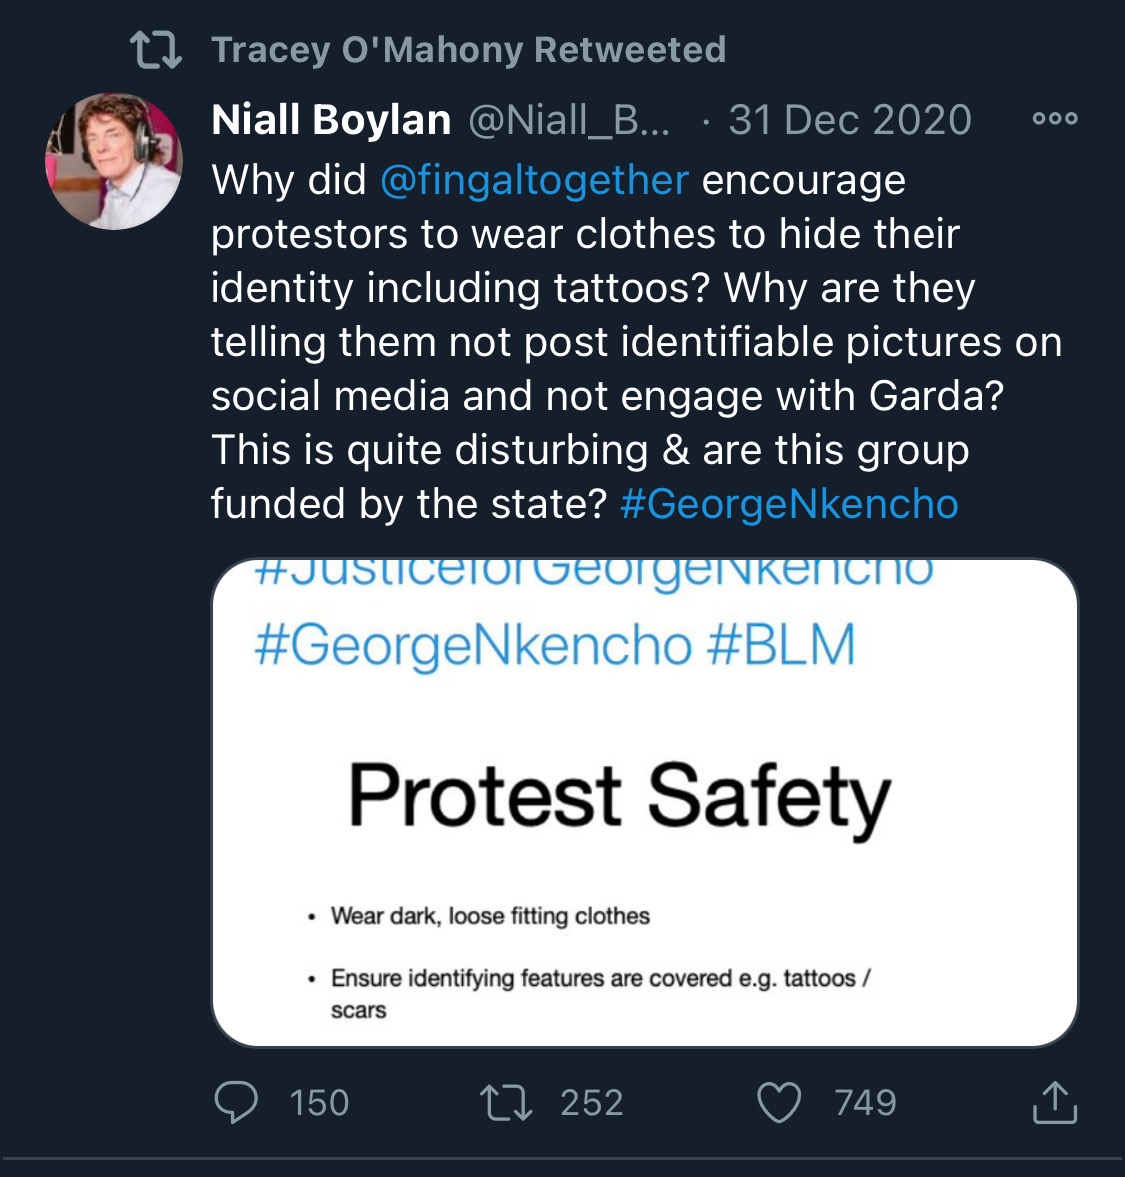
There is co-ordination across the far right in Ireland now to stir both left and right in the hopes of creating a race war. Think critically! Fascists see the tragic killing of #georgenkencho, the grief of his community and pending investigation as a flashpoint for action.
Across Telegram, Twitter and Facebook disinformation is being peddled on the back of these tragic events. From false photographs to the tactics ofwhite supremacy, the far right is clumsily trying to drive hate against minority groups and figureheads.
Be aware, the images the #farright are sharing in the hopes of starting a race war, are not of the SPAR employee that was punched. They\u2019re older photos of a Everton fan. Be aware of the information you\u2019re sharing and that it may be false. Always #factcheck #GeorgeNkencho pic.twitter.com/4c9w4CMk5h
— antifa.drone (@antifa_drone) December 31, 2020
Declan Ganley’s Burkean group and the incel wing of National Party (Gearóid Murphy, Mick O’Keeffe & Co.) as well as all the usuals are concerted in their efforts to demonstrate their white supremacist cred. The quiet parts are today being said out loud.
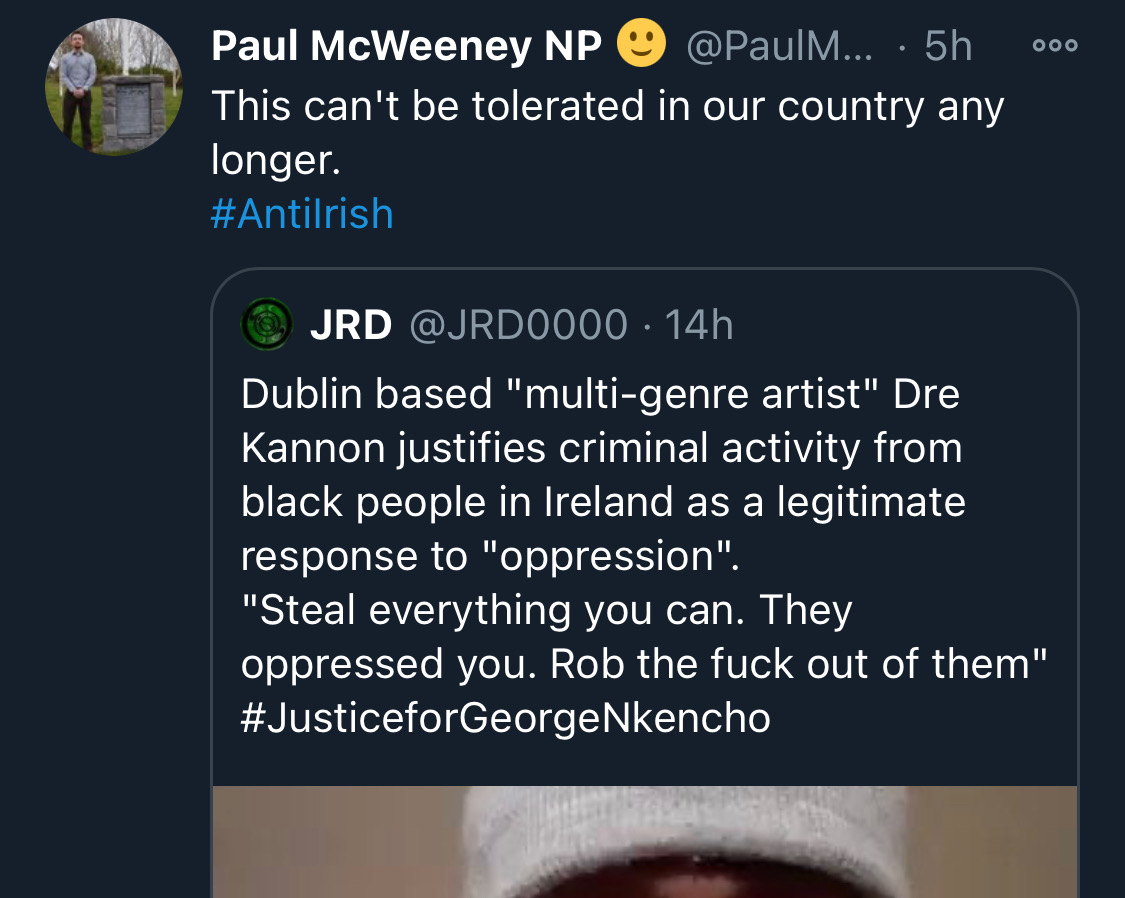
There is a concerted effort in far-right Telegram groups to try and incite violence on street by targetting people for racist online abuse following the killing of George Nkencho
— Mark Malone (@soundmigration) January 1, 2021
This follows on and is part of a misinformation campaign to polarise communities at this time.
The best thing you can do is challenge disinformation and report posts where engagement isn’t appropriate. Many of these are blatantly racist posts designed to drive recruitment to NP and other Nationalist groups. By all means protest but stay safe.