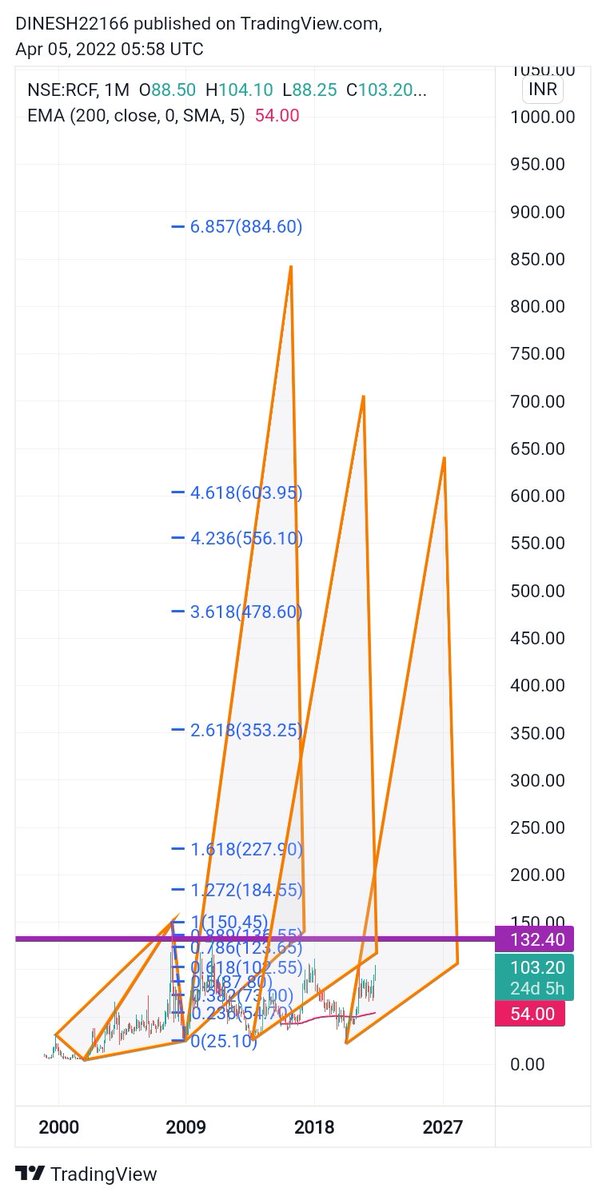
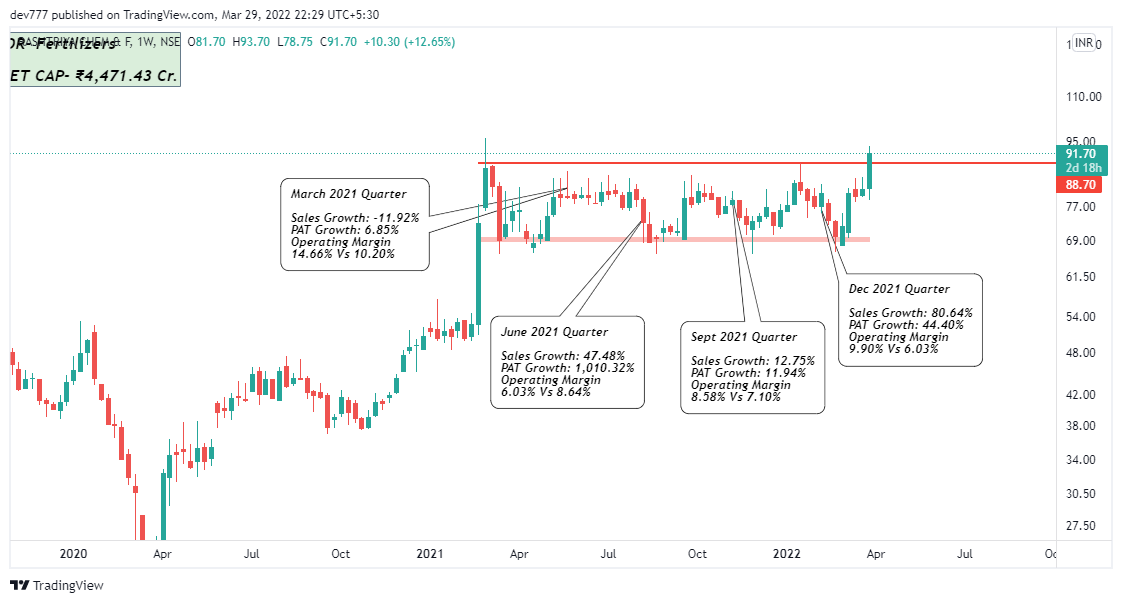
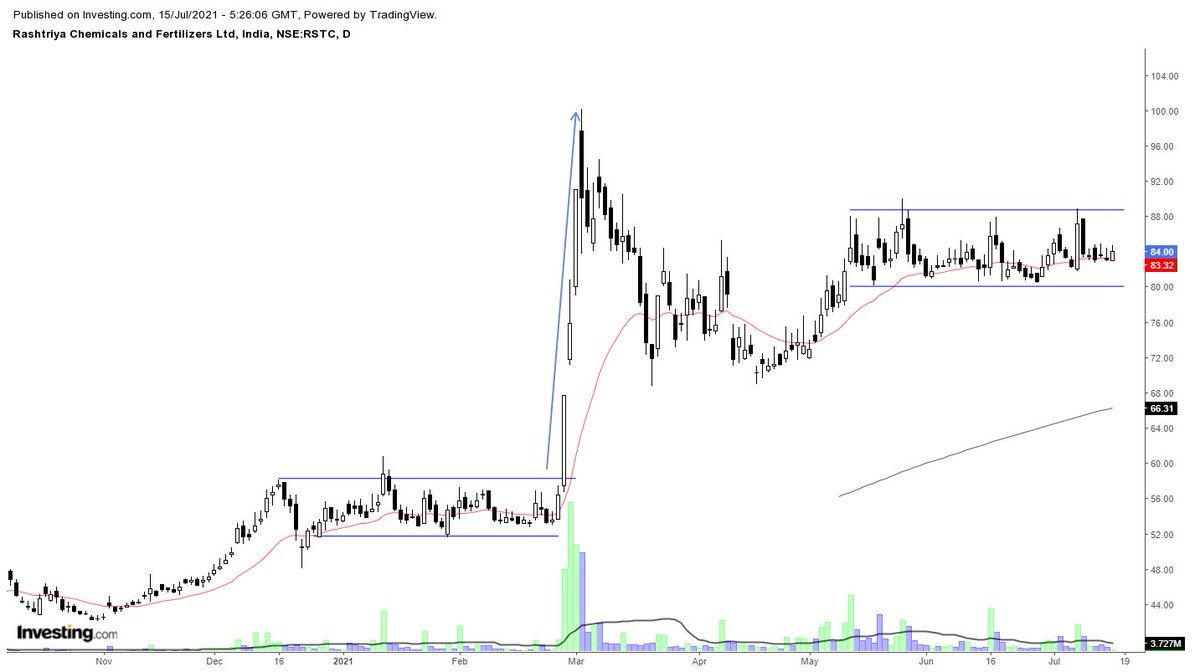
Rashtriya Chemicals & Fertilizers RCF -
a chart that caught my attention immediately. My favorite horizontal range with volume contraction. Will wait for breakout/breakdown in this. Lots of big green candles in the range. On radar.
More from Steve Nison
Deepak nitrite
Explained you same concept with Elxsi. The real test of a strong Breakout is that the big hand will not give you another chance to buy the share at the breakout level. They will absorb all the selling of weak hands. I mean "STRONG breakout". https://t.co/7fxFqGQl3p
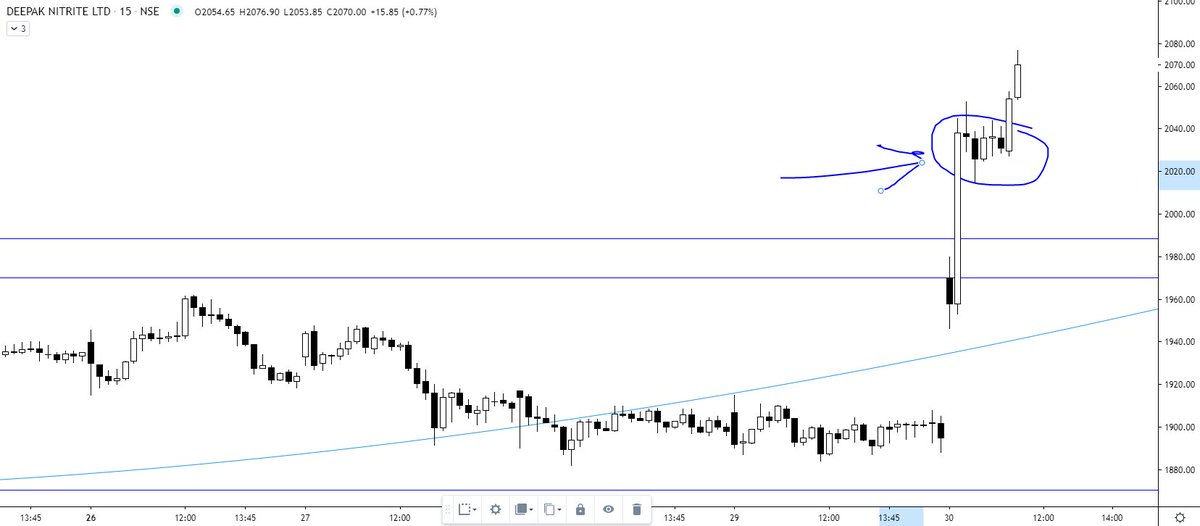
Explained you same concept with Elxsi. The real test of a strong Breakout is that the big hand will not give you another chance to buy the share at the breakout level. They will absorb all the selling of weak hands. I mean "STRONG breakout". https://t.co/7fxFqGQl3p
Tata Elxsi ---
— Steve Nison (@nison_steve) June 30, 2021
In the last 10 minutes, all the selling was absorbed despite intraday positions being squared off (if not converted). will wait for the EOD data. However, the chart structure is extremely strong. https://t.co/pci7GCDBEO pic.twitter.com/1NBD9V3mKc

These high-volume selloff candles right before any -ve news always intrigue me. the same thing happened with Infosys before the whistleblower complaint was out & the stock gapped down. TV 18 & VTL were other examples.
Fresh case - RUPA https://t.co/nqq5nI1wLU
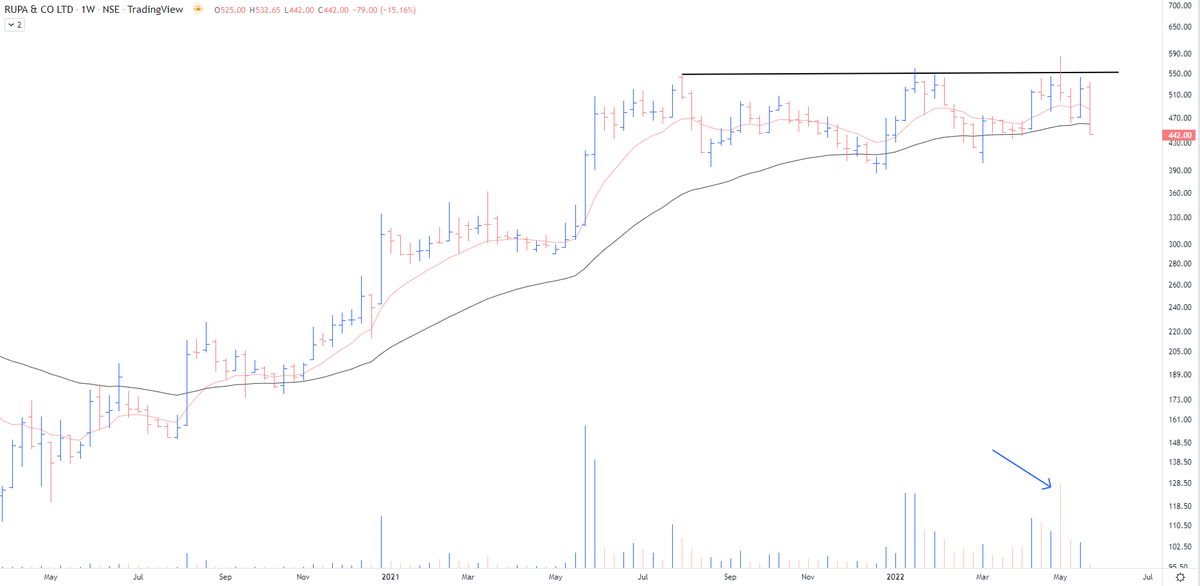
Fresh case - RUPA https://t.co/nqq5nI1wLU
Respect your stop losses in the stocks that have gone down today with heavy volumes even on a strong day.
— The_Chartist \U0001f4c8 (@charts_zone) March 17, 2022
VTL pic.twitter.com/3pJ9XngCDL