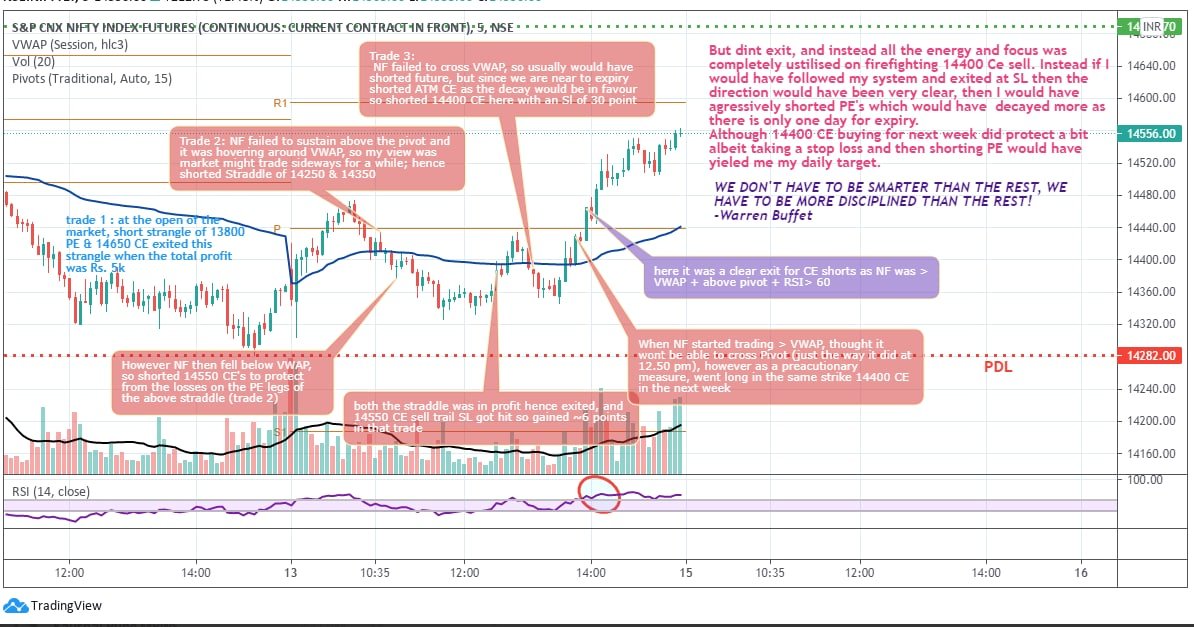
R2 se niche vwap se niche aya ek baar bhi uske upar nahi gaya ek baar vwap ke upar aya par R1 ke upar nahi tika simple

More from itrade(DJ)


More from Optionslearnings


THREAD: 14 of the best resources/topics for anyone who wants to start option selling as a career. 🧵
Collaborated with @niki_poojary
1. Best Sources of knowledge for a beginner in option selling?
Zerodha Varsity from @Nithin0dha's team & the @tastytrade financial network.
Links:
2. Top YouTube Channel for Options Learning?
Power of Stocks - Subhasish Pani
What you'll learn:
1. How to form a trading plan.
2. How to scale an account with risk-reward in option selling.
3. Technical analysis logics you can use daily.
15
3. What are the preconditions to start option Selling:
You should know technical Analysis basics like:
- Support/Resistance
- Chart Patterns
- Candle Patterns
- Dow Theory (HH, LL)
This will help you start taking high probability trades.
4. Risk Management is a must for option selling
If you don't learn to manage your risk, making money in trading is going to be an extremely difficult endeavor
Have some rules:
1. Risk no more than 0.25% per trade as a beginner
2. Risk no more than 2% in a day for the first year
Collaborated with @niki_poojary
1. Best Sources of knowledge for a beginner in option selling?
Zerodha Varsity from @Nithin0dha's team & the @tastytrade financial network.
Links:
2. Top YouTube Channel for Options Learning?
Power of Stocks - Subhasish Pani
What you'll learn:
1. How to form a trading plan.
2. How to scale an account with risk-reward in option selling.
3. Technical analysis logics you can use daily.
15
15 Learnings from Power of Stocks: \U0001f9f5
— Aditya Todmal (@AdityaTodmal) January 23, 2022
Collaborated with @niki_poojary
3. What are the preconditions to start option Selling:
You should know technical Analysis basics like:
- Support/Resistance
- Chart Patterns
- Candle Patterns
- Dow Theory (HH, LL)
This will help you start taking high probability trades.
4. Risk Management is a must for option selling
If you don't learn to manage your risk, making money in trading is going to be an extremely difficult endeavor
Have some rules:
1. Risk no more than 0.25% per trade as a beginner
2. Risk no more than 2% in a day for the first year

Low VIX doesn't necessarily mean ideal time for option buyers. If premiums aren't falling consistently during the day in low VIX, it usually gives those small delta & IV spikes, just enough to irritate both option buyers & sellers. Same happens when VIX is ultra high.
@SarangSood Sarang bhai according to you what number of vix is ideal for option buyers and what is that for option sellers? And is there any common number which is ideal for both?
— Dhaval bhatt (@Dhavalb55011726) July 14, 2021