

More from Nikita Poojary

• Free Price action course worth 50k
• Best videos to learn expiry trading
• Bollinger Band set up with min 1:4 RR
• Hacks to avail tradingview premium features for free
and much more 🧵
1/: Eight websites that F&O trades just can't afford to
These 8 websites will answer 80% of your FNO research questions! \U0001f9f5
— Aditya Todmal (@AdityaTodmal) October 1, 2022
Collaborated with @niki_poojary
2/ Bollinger band set up with minimum 1:4 R/R by Subasish
A set up which has a minimum Risk/Reward (R/R) of 1:4
— Nikita Poojary (@niki_poojary) October 2, 2022
This set up can be used for intraday, option selling, option buying, as well as investing.
Maximum profit strategy by Subasish Pani.
Bollinger band set-up: \U0001f9f5!
Collaborated with @AdityaTodmal pic.twitter.com/aEIUVQF2XY
3/ Eight books on Option trading that every trader should
8 Options Trading books that every trader should read: \U0001f4da
— Aditya Todmal (@AdityaTodmal) October 2, 2022
Collaborated with @niki_poojary
4/ List of threads to make you a pro in option
Option Selling allowed me to 10x my career and income.
— Aditya Todmal (@AdityaTodmal) October 7, 2022
Some of the Top 1% of the traders have mastered this skill.
Here are 5 threads to make you a pro today (completely free):
Collaborated with @niki_poojary
\U0001f9f5
More from Nifty


Till it breakouts expect pendulum swings within this structure.
I am positive for 19300-20000 above 18350.
Bottoms 16800-17000 in place and 200dema at 16600. Dont see any big cut. @moneyworks4u_fa https://t.co/lceGFlDyRM
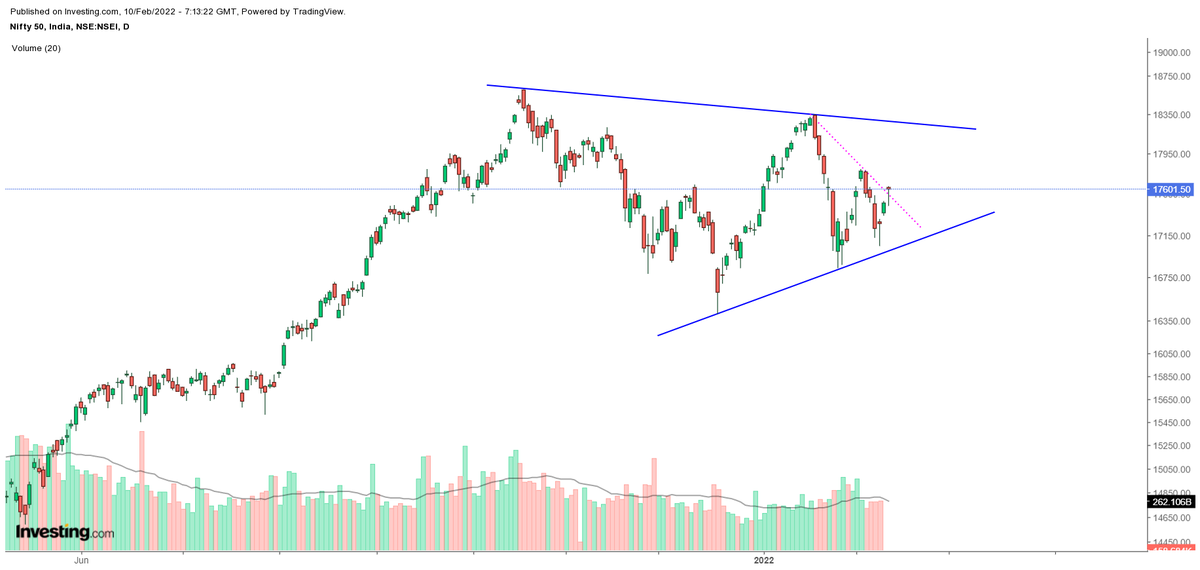
#Nifty taking a shape of triangle rather than CNH.
— Shivaji Vitthalrao\U0001f1ee\U0001f1f3 (@shivaji_1983) January 29, 2022
Confirmation point is same 18350 and targets also same as below \U0001f447
Traingle /CNH whats in a name as long as targets and Confirmation point is same. https://t.co/vfM1odTd94


So now that Nifty has undergone ABC correction in the expected manner, what to expect next?
I think we have started larger degree wave 3, once 16800 was crossed.
16800 is the reference level now. We will get more sense by end of next week/ month. https://t.co/KsziuUpZxU
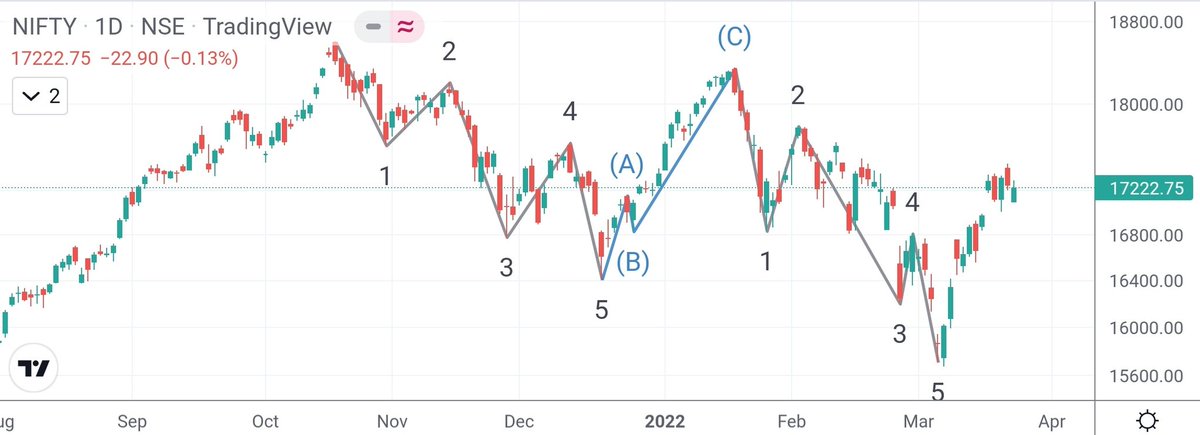
I am no expert in Wave Theory, but can this be a possible path over next few weeks/months?
— Mayank Narula (@Mayank_Narula1) December 6, 2021
Views requested. @idineshptl @indiacharts @nishkumar1977 pic.twitter.com/u3DjEeqoqB
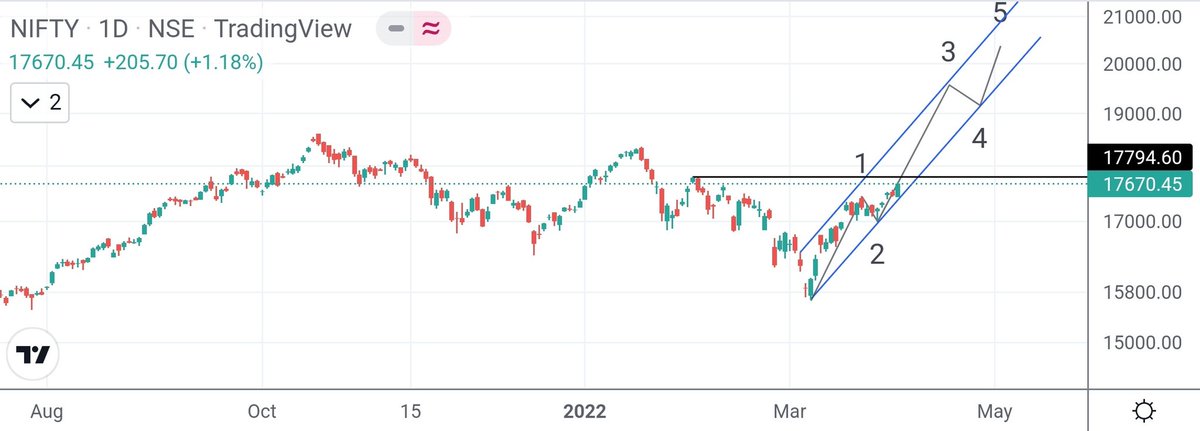
#NIFTY
If 17445 is taken out, then may be we are heading to fresh new all time on Nifty.
Things may pan out way faster than expected.
#NIFTY
Zoomed in cross-section of the chart above.
Wave 3 of 1 should have started today, which can take Nifty to fresh all time highs.
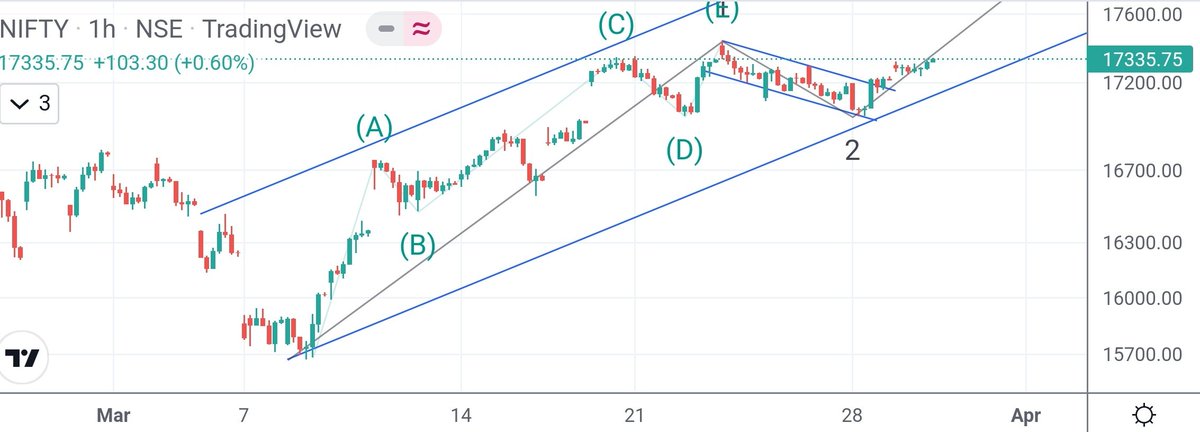
#NIFTY
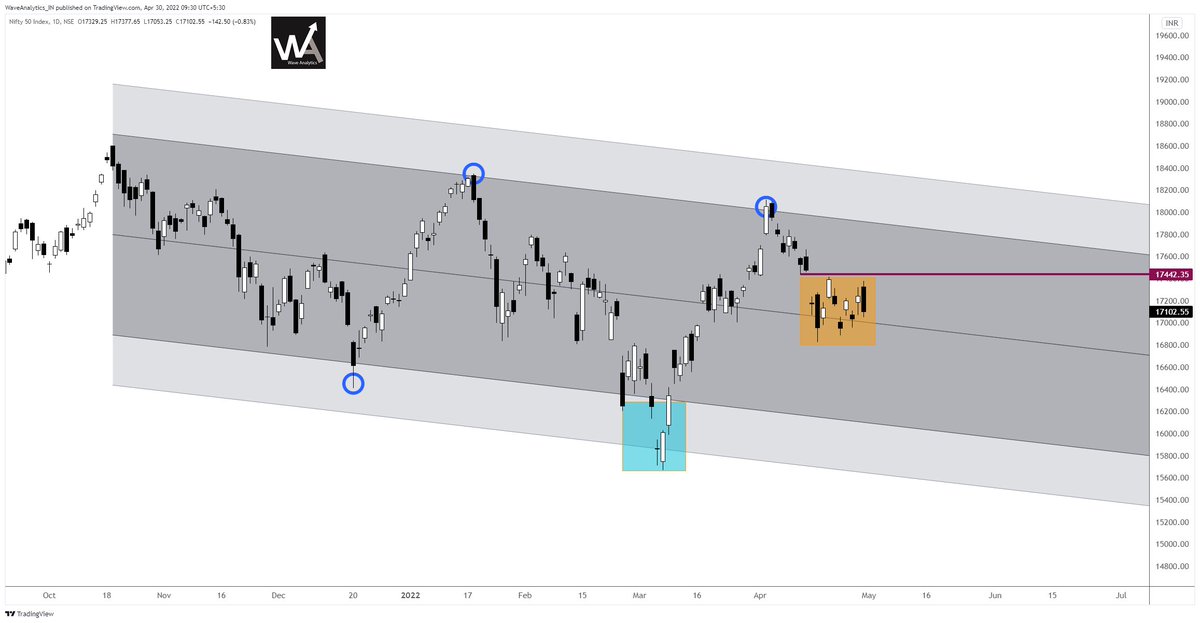
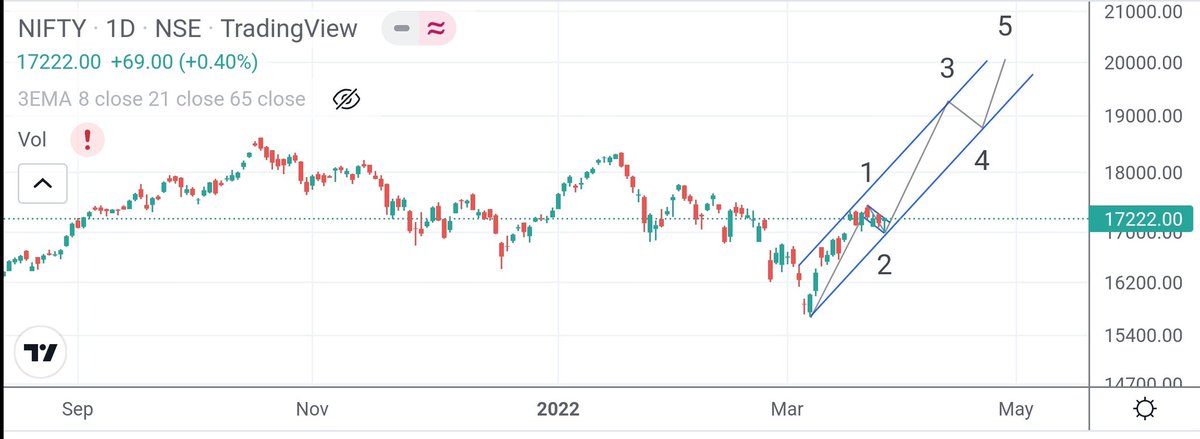
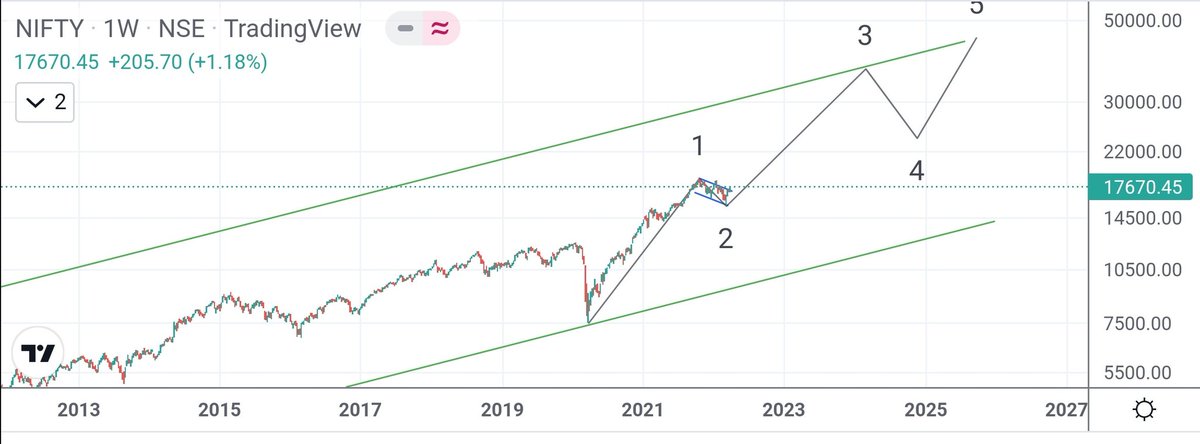
So now Nifty is moving more clearly on the expected path, what's next?
Nifty has started longer term wave 3 advancement, pending final confirmation of HH by crossing 17800.
In Wave 1 of 3, can expect a move to 20k+.
In terms of longer term wave structure:
Wave 1: 7500 to 18600
Wave 3: 15700 to 35000+
And this can pan out over next 2 years or so.
Since wave 2 was a shallow correction, wave 4 can potentially be a deeper correction.
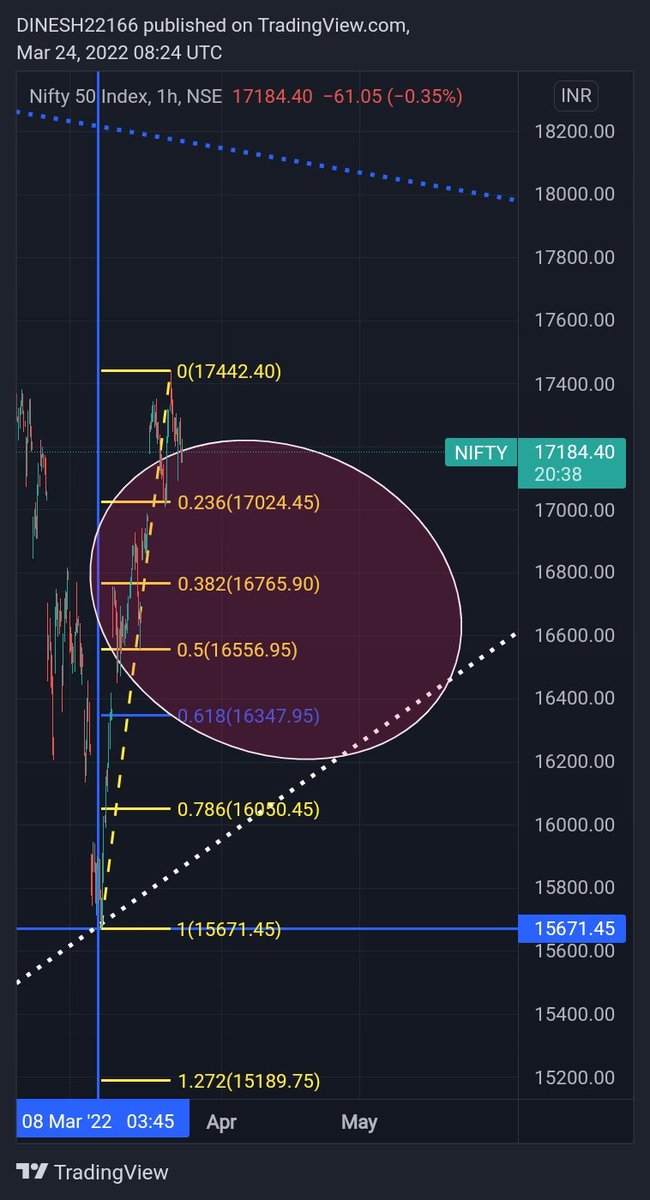
Low made 17129.55
Objective 0.382% (17181) #done.
If nifty not sustain above today and high and gap remain gap than more downside open till Fibonacci retracement
0.50%(16893) and 0.618%(16604
#Probability
#NiFTY_50(17475)
— Waves_Perception(Dinesh Patel) \u092e\u0948\u0902Schedule Tribe) (@idineshptl) April 17, 2022
Daily chart and monthly chart.
Dail chart show Fibonacci retracement level 1st 0.236% done.
Next objetive is to test 2nd 0.382%17181 during the entire week and close near to it.#MACD#RSI pic.twitter.com/Bt9bJuHDFh
You May Also Like


Decoded his way of analysis/logics for everyone to easily understand.
Have covered:
1. Analysis of volatility, how to foresee/signs.
2. Workbook
3. When to sell options
4. Diff category of days
5. How movement of option prices tell us what will happen
1. Keeps following volatility super closely.
Makes 7-8 different strategies to give him a sense of what's going on.
Whichever gives highest profit he trades in.
I am quite different from your style. I follow the market's volatility very closely. I have mock positions in 7-8 different strategies which allows me to stay connected. Whichever gives best profit is usually the one i trade in.
— Sarang Sood (@SarangSood) August 13, 2019
2. Theta falls when market moves.
Falls where market is headed towards not on our original position.
Anilji most of the time these days Theta only falls when market moves. So the Theta actually falls where market has moved to, not where our position was in the first place. By shifting we can come close to capturing the Theta fall but not always.
— Sarang Sood (@SarangSood) June 24, 2019
3. If you're an options seller then sell only when volatility is dropping, there is a high probability of you making the right trade and getting profit as a result
He believes in a market operator, if market mover sells volatility Sarang Sir joins him.
This week has been great so far. The main aim is to be in the right side of the volatility, rest the market will reward.
— Sarang Sood (@SarangSood) July 3, 2019
4. Theta decay vs Fall in vega
Sell when Vega is falling rather than for theta decay. You won't be trapped and higher probability of making profit.
There is a difference between theta decay & fall in vega. Decay is certain but there is no guaranteed profit as delta moves can increase cost. Fall in vega on the other hand is backed by a powerful force that sells options and gives handsome returns. Our job is to identify them.
— Sarang Sood (@SarangSood) February 12, 2020


