
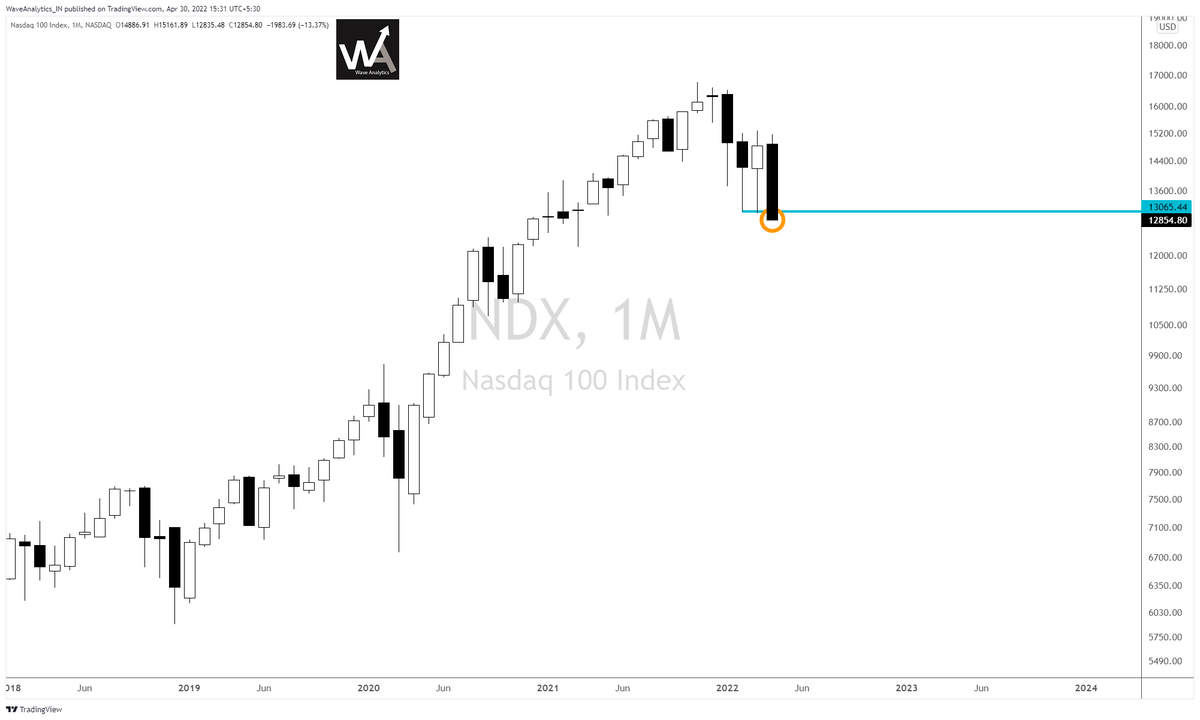
Nasdaq has now broken and closed below the Low of Two consecutive Hammers on Monthly Charts.
More from Piyush Chaudhry
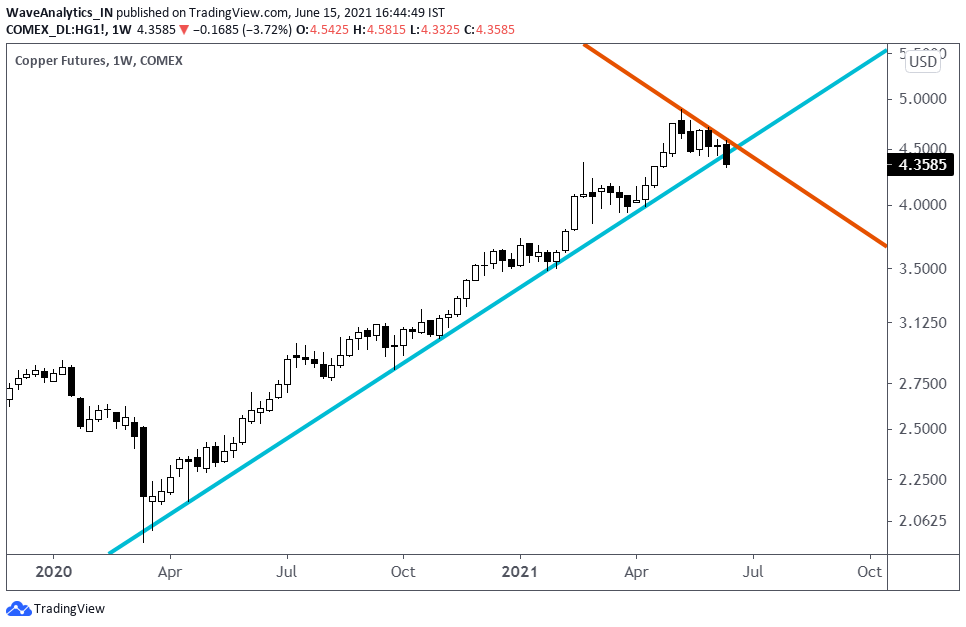
Copper breaching the rising Trendline.
Weekly Candles, so we still need to wait.
Earlier two tweets on Copper:
1. Copper - EM:
https://t.co/WogWRMIMHH
and,
2. Copper - Gold
https://t.co/Cq2zcn4bi3
Weekly Candles, so we still need to wait.
Earlier two tweets on Copper:
1. Copper - EM:
https://t.co/WogWRMIMHH
and,
2. Copper - Gold
https://t.co/Cq2zcn4bi3
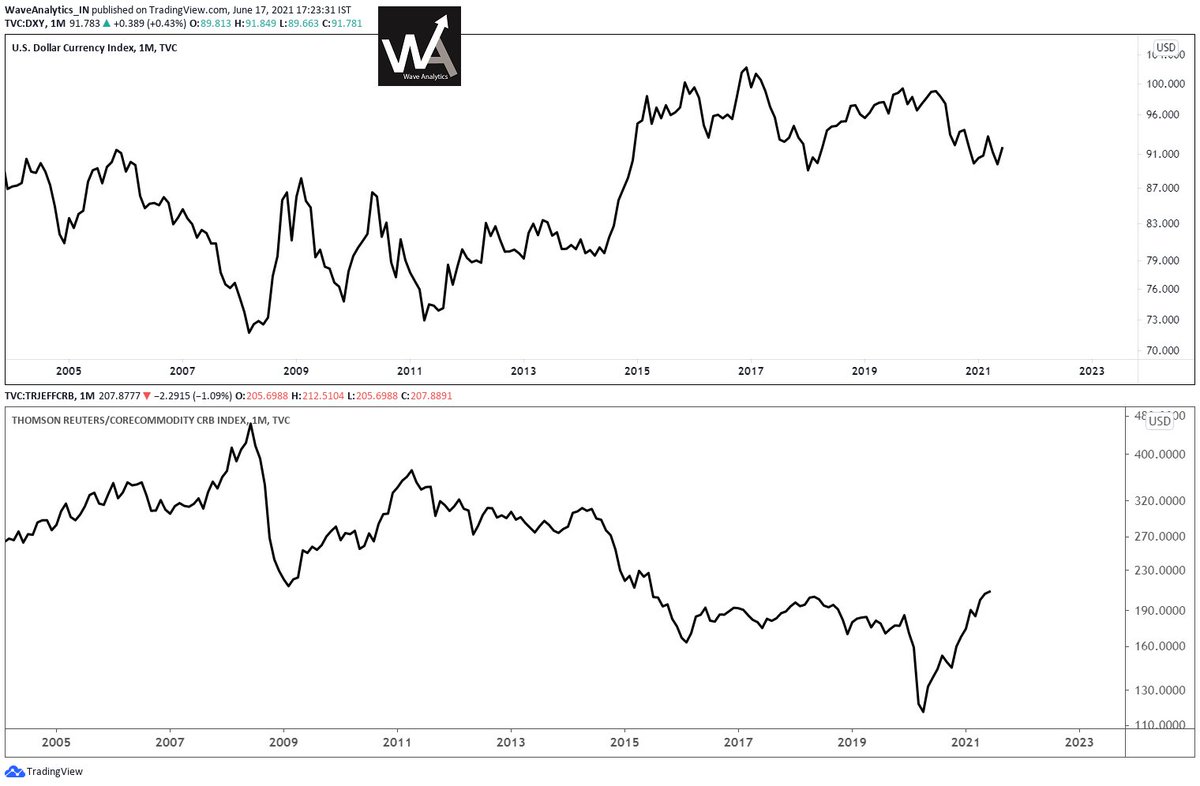
Amazingly super positive correlation between Emerging Markets and Copper.
— Piyush Chaudhry (@piyushchaudhry) June 2, 2021
*MSCI Emerging Markets ETF #EEM
*Copper Futures #Comex pic.twitter.com/rVAwfqvqD4

#repost
On the last two instances, when #Brent #CrudeOil crossed 90, NIFTY (in Blue - Left scale) underwent Correction both the times. This is the third such instance.
— Piyush Chaudhry (@piyushchaudhry) February 12, 2022
Below 90, NIFTY & Brent have had positive correlation, with 90 acting as an inflection point & causing the Divergence. pic.twitter.com/Q9dj8YFpuV
#repost
#NIFTY in Regression Channel.
— Piyush Chaudhry (@piyushchaudhry) April 30, 2022
A rectangular consolidation around the central Line of Best Fit, with no such reversal characteristics on display yet.
For it to revisit the upper band, odds would increase only on a break above ~17450.
Else, it's a slippery slope. pic.twitter.com/4OT7JM1TJY
You May Also Like


Keep dwelling on this:
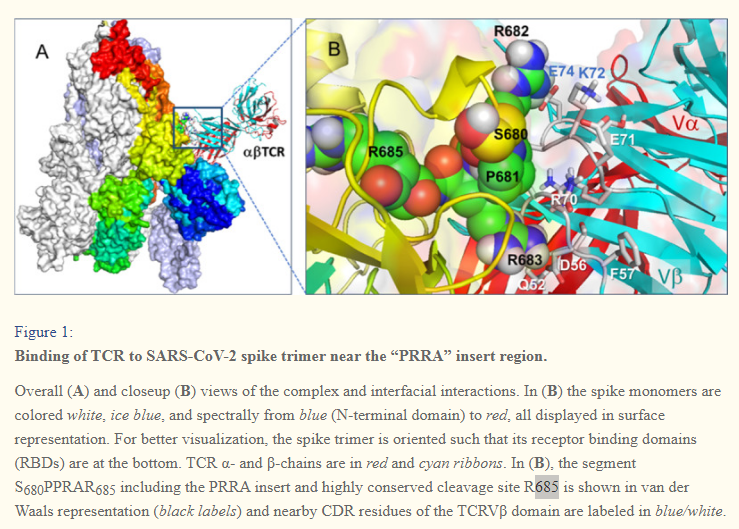
Further Examination of the Motif near PRRA Reveals Close Structural Similarity to the SEB Superantigen as well as Sequence Similarities to Neurotoxins and a Viral SAg.
The insertion PRRA together with 7 sequentially preceding residues & succeeding R685 (conserved in β-CoVs) form a motif, Y674QTQTNSPRRAR685, homologous to those of neurotoxins from Ophiophagus (cobra) and Bungarus genera, as well as neurotoxin-like regions from three RABV strains
(20) (Fig. 2D). We further noticed that the same segment bears close similarity to the HIV-1 glycoprotein gp120 SAg motif F164 to V174.
https://t.co/EwwJOSa8RK
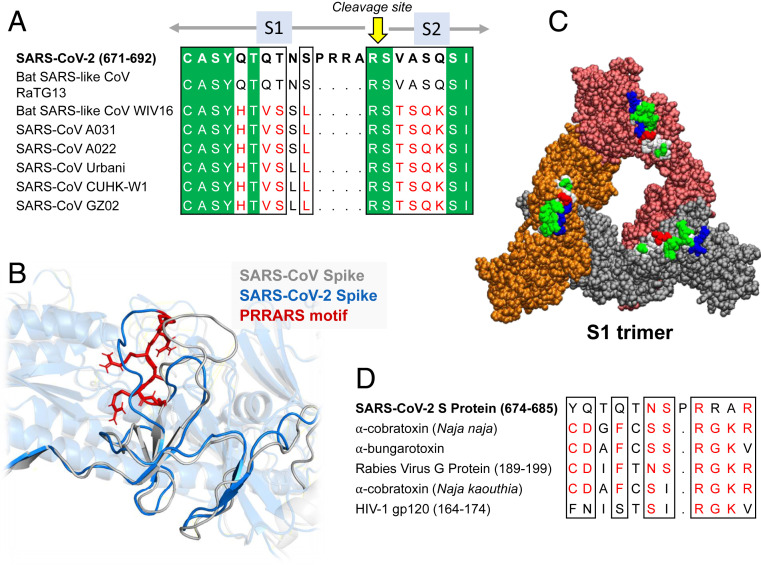
In (B), the segment S680PPRAR685 including the PRRA insert and highly conserved cleavage site *R685* is shown in van der Waals representation (black labels) and nearby CDR residues of the TCRVβ domain are labeled in blue/white
https://t.co/BsY8BAIzDa
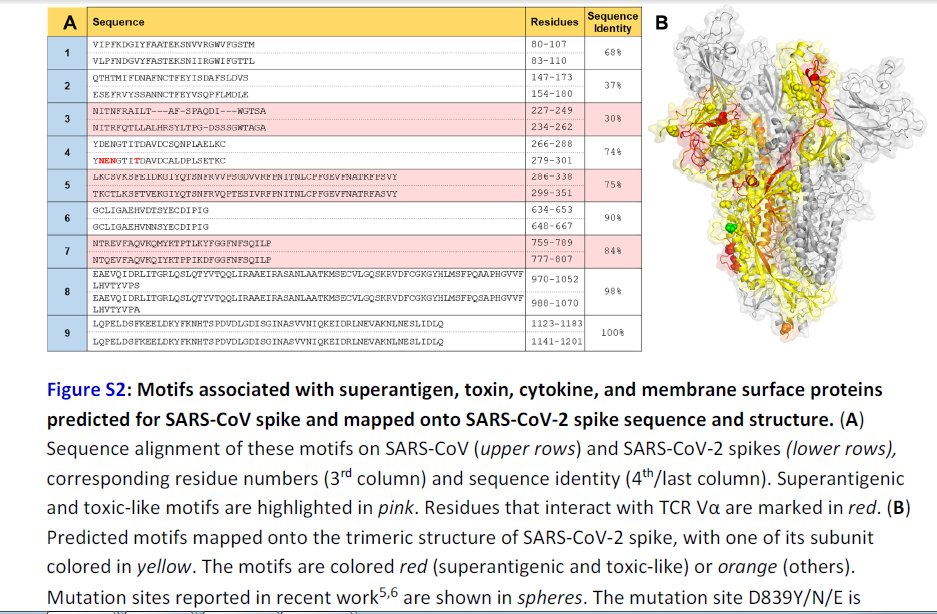
Sequence Identity %
https://t.co/BsY8BAIzDa
Y674 - QTQTNSPRRA - R685
Similar to neurotoxins from Ophiophagus (cobra) & Bungarus genera & neurotoxin-like regions from three RABV strains
T678 - NSPRRA- R685
Superantigenic core, consistently aligned against bacterial or viral SAgs
Further Examination of the Motif near PRRA Reveals Close Structural Similarity to the SEB Superantigen as well as Sequence Similarities to Neurotoxins and a Viral SAg.
The insertion PRRA together with 7 sequentially preceding residues & succeeding R685 (conserved in β-CoVs) form a motif, Y674QTQTNSPRRAR685, homologous to those of neurotoxins from Ophiophagus (cobra) and Bungarus genera, as well as neurotoxin-like regions from three RABV strains
(20) (Fig. 2D). We further noticed that the same segment bears close similarity to the HIV-1 glycoprotein gp120 SAg motif F164 to V174.
https://t.co/EwwJOSa8RK
In (B), the segment S680PPRAR685 including the PRRA insert and highly conserved cleavage site *R685* is shown in van der Waals representation (black labels) and nearby CDR residues of the TCRVβ domain are labeled in blue/white
https://t.co/BsY8BAIzDa
Sequence Identity %
https://t.co/BsY8BAIzDa
Y674 - QTQTNSPRRA - R685
Similar to neurotoxins from Ophiophagus (cobra) & Bungarus genera & neurotoxin-like regions from three RABV strains
T678 - NSPRRA- R685
Superantigenic core, consistently aligned against bacterial or viral SAgs


#sculpture #story -
Chandesha-Anugraha Murti - One of the Sculpture in Brihadeshwara Temple at Gangaikonda Cholapuram - built by Raja Rajendra Chola I
This Sculpture depicts Bhagwan Shiva along with Devi Paravathi blessing Chandeshwara - one of the 63 Nayanmars.
#Thread
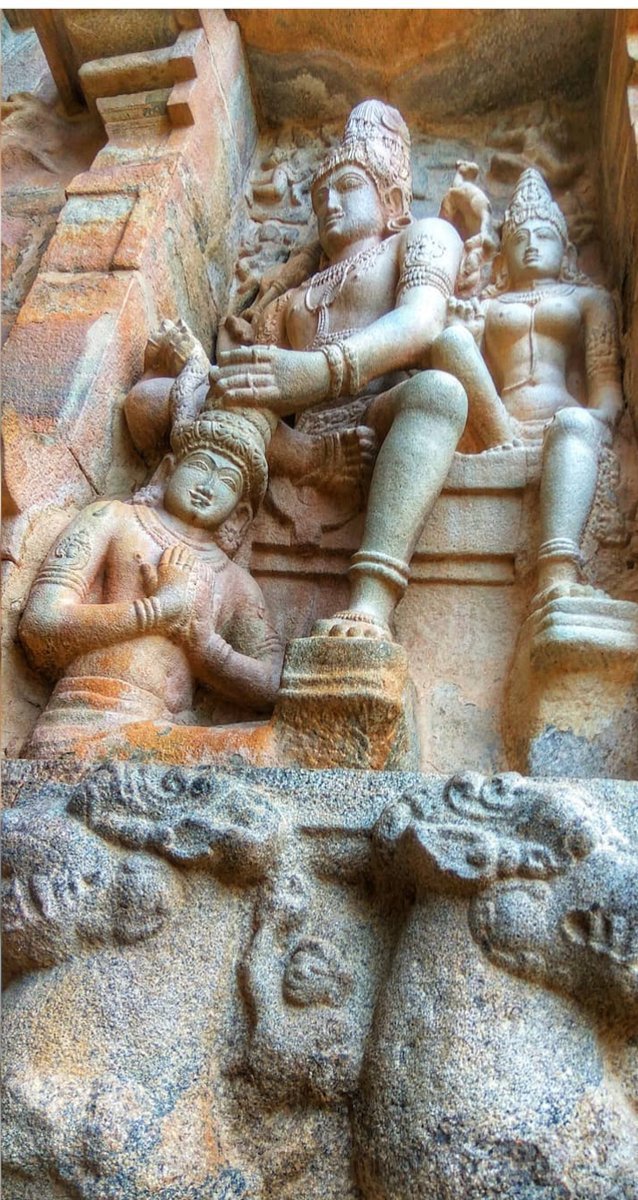
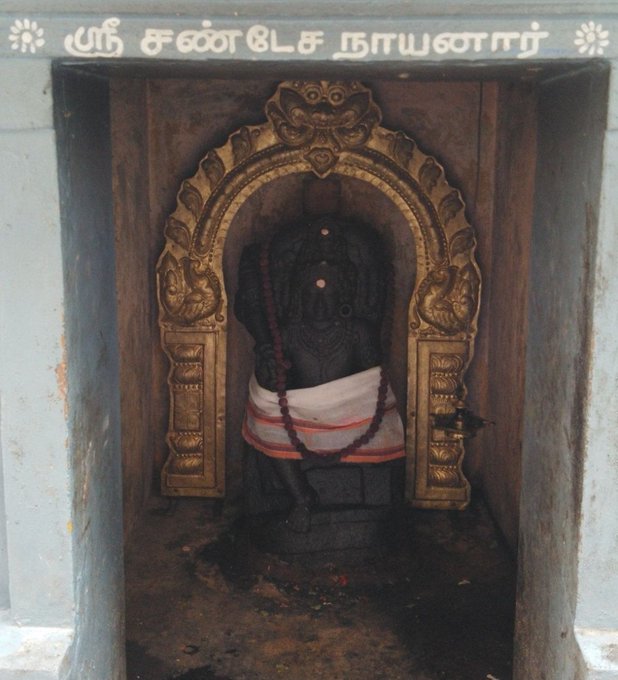
Chandeshwara/Chandikeshwara is regarded as custodian of Shiva Temple's wealth&most of Shiva temples in South India has separate sannathi for him.
His bhakti for Bhagwan Shiva elevated him as one of foremost among Nayanmars.
He gave importance to Shiva Pooja&protection of cows.
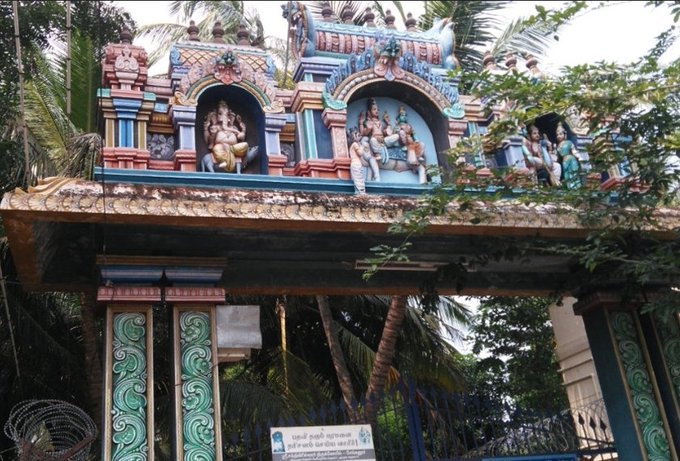
There are series of paintings, illustrating the #story of Chandikeshwar in the premises of
Sri Sathiyagireeswarar #Temple at Seinganur,near Kumbakonam,TN
Chandikeshwara's birth name
is Vichara sarman.He was born in the village of Senganur on the banks of River Manni.
His Parent names were Yajnathatan and Pavithrai.
Vichara Sarman was a gifted child and he learnt Vedas and Agamas at a very young age.
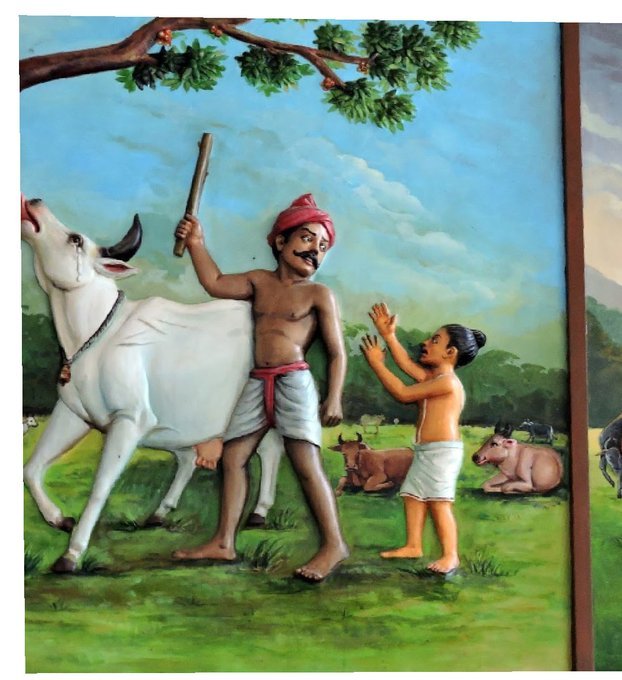
He was very devout and would always think about Bhagwan Shiva.
One day he saw a cowherd man brutally assaulting a cow,Vichara Sarman could not tolerate this. He spoke to cowherd: ‘Do you not know that the cow is worshipful & divine? All gods & Devas reside in https://t.co/ElLcI5ppsK it is our duty to protect cows &we should not to harm them.
Chandesha-Anugraha Murti - One of the Sculpture in Brihadeshwara Temple at Gangaikonda Cholapuram - built by Raja Rajendra Chola I
This Sculpture depicts Bhagwan Shiva along with Devi Paravathi blessing Chandeshwara - one of the 63 Nayanmars.
#Thread
Chandeshwara/Chandikeshwara is regarded as custodian of Shiva Temple's wealth&most of Shiva temples in South India has separate sannathi for him.
His bhakti for Bhagwan Shiva elevated him as one of foremost among Nayanmars.
He gave importance to Shiva Pooja&protection of cows.
There are series of paintings, illustrating the #story of Chandikeshwar in the premises of
Sri Sathiyagireeswarar #Temple at Seinganur,near Kumbakonam,TN
Chandikeshwara's birth name
is Vichara sarman.He was born in the village of Senganur on the banks of River Manni.
His Parent names were Yajnathatan and Pavithrai.
Vichara Sarman was a gifted child and he learnt Vedas and Agamas at a very young age.
He was very devout and would always think about Bhagwan Shiva.
One day he saw a cowherd man brutally assaulting a cow,Vichara Sarman could not tolerate this. He spoke to cowherd: ‘Do you not know that the cow is worshipful & divine? All gods & Devas reside in https://t.co/ElLcI5ppsK it is our duty to protect cows &we should not to harm them.